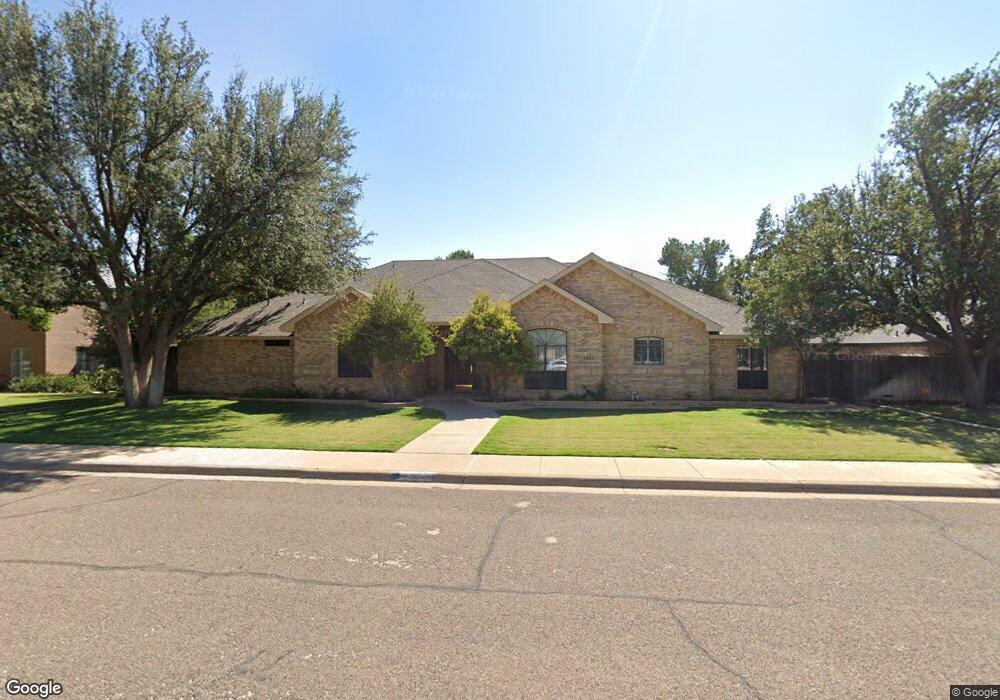
3605 Woodhaven Ct Midland, TX 79707
Trinity NeighborhoodEstimated Value: $709,000 - $850,000
--
Bed
--
Bath
4,315
Sq Ft
$187/Sq Ft
Est. Value
About This Home
This home is located at 3605 Woodhaven Ct, Midland, TX 79707 and is currently estimated at $805,715, approximately $186 per square foot. 3605 Woodhaven Ct is a home located in Midland County with nearby schools including Parker Elementary School, Alamo Junior High School, and Robert H. Goddard Junior High School.
Ownership History
Date
Name
Owned For
Owner Type
Purchase Details
Closed on
Dec 6, 2012
Sold by
Singh Tulsi and Singh Claudette Y
Bought by
Miaphia Family Lp
Current Estimated Value
Home Financials for this Owner
Home Financials are based on the most recent Mortgage that was taken out on this home.
Original Mortgage
$200,000
Outstanding Balance
$138,335
Interest Rate
3.41%
Mortgage Type
New Conventional
Estimated Equity
$667,380
Purchase Details
Closed on
Mar 7, 2011
Sold by
Johnson Dennis R and Johnson Laquita
Bought by
Johnson Christopher Paul and Johnson Premila L S
Purchase Details
Closed on
Jun 29, 1989
Bought by
Johnson Christopher Paul
Purchase Details
Closed on
Feb 16, 1989
Bought by
Johnson Christopher Paul
Purchase Details
Closed on
Oct 29, 1987
Bought by
Johnson Christopher Paul
Purchase Details
Closed on
Oct 15, 1987
Bought by
Johnson Christopher Paul
Create a Home Valuation Report for This Property
The Home Valuation Report is an in-depth analysis detailing your home's value as well as a comparison with similar homes in the area
Home Values in the Area
Average Home Value in this Area
Purchase History
| Date | Buyer | Sale Price | Title Company |
|---|---|---|---|
| Miaphia Family Lp | -- | Lone Star Abstract & Title C | |
| Johnson Christopher Paul | -- | None Available | |
| Johnson Christopher Paul | -- | -- | |
| Johnson Christopher Paul | -- | -- | |
| Johnson Christopher Paul | -- | -- | |
| Johnson Christopher Paul | -- | -- |
Source: Public Records
Mortgage History
| Date | Status | Borrower | Loan Amount |
|---|---|---|---|
| Open | Miaphia Family Lp | $200,000 |
Source: Public Records
Tax History Compared to Growth
Tax History
| Year | Tax Paid | Tax Assessment Tax Assessment Total Assessment is a certain percentage of the fair market value that is determined by local assessors to be the total taxable value of land and additions on the property. | Land | Improvement |
|---|---|---|---|---|
| 2025 | $10,433 | $785,410 | $42,680 | $742,730 |
| 2024 | $10,449 | $793,760 | $42,680 | $751,080 |
| 2023 | $11,292 | $753,520 | $42,680 | $710,840 |
| 2022 | $12,202 | $780,950 | $42,680 | $738,270 |
| 2021 | $13,887 | $797,120 | $42,680 | $754,440 |
| 2020 | $13,461 | $776,700 | $42,680 | $734,020 |
| 2019 | $13,439 | $709,860 | $42,680 | $734,020 |
| 2018 | $12,547 | $645,330 | $42,680 | $636,190 |
| 2017 | $11,407 | $586,660 | $42,680 | $543,980 |
| 2016 | $10,974 | $563,370 | $42,680 | $520,690 |
| 2015 | -- | $563,370 | $42,680 | $520,690 |
| 2014 | -- | $536,180 | $0 | $0 |
Source: Public Records
Map
Nearby Homes
- 3400 Salisbury Place
- 3901 Arroyo Dr
- 3322 Providence Dr
- 3506 Meadowridge Ln
- 3303 Windsor Dr
- 3302 Windsor Dr
- 4200 Boulder Dr
- 3323 Maxwell Dr
- 4203 Skyline Dr
- 3400 Wedgwood St
- 3513 Jordan Ave
- 3619 W Wadley Ave
- 4303 Arroyo Dr
- 4101 Gleneagles Dr
- 4313 Valley Dr
- 3206 Haynes Dr
- 4003 Compton Dr
- 3200 Highsky Dr
- 3207 Marmon Dr
- 4207 Merrill Dr
- 3603 Woodhaven Ct
- 3607 Woodhaven Ct
- 3602 Trinity Dr
- 3601 Woodhaven Ct
- 3604 Woodhaven Ct
- 3604 Trinity Dr
- 3604 Trinity Dr
- 3602 Woodhaven Ct
- 3600 Trinity Dr
- 3606 Woodhaven Ct
- 3600 Woodhaven Ct
- 3700 Trinity Dr
- 3513 Woodhaven Dr
- 3603 Northfield Dr
- 3605 Northfield Dr
- 3601 Northfield Dr
- 3512 Woodhaven Dr
- 3702 Trinity Dr
- 3402 Salisbury Place
- 3408 Trinity Dr