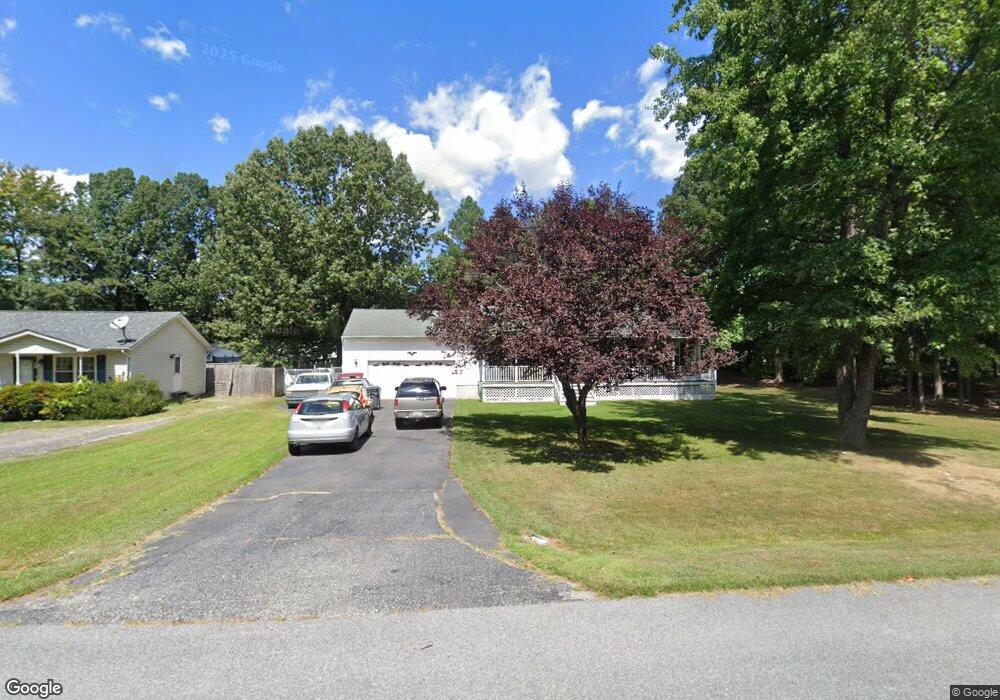
36055 Army Navy Dr Mechanicsville, MD 20659
Estimated Value: $346,647 - $364,000
--
Bed
2
Baths
1,144
Sq Ft
$312/Sq Ft
Est. Value
About This Home
This home is located at 36055 Army Navy Dr, Mechanicsville, MD 20659 and is currently estimated at $357,162, approximately $312 per square foot. 36055 Army Navy Dr is a home located in St. Mary's County with nearby schools including Dynard Elementary School, Margaret Brent Middle School, and Chopticon High School.
Ownership History
Date
Name
Owned For
Owner Type
Purchase Details
Closed on
Aug 30, 2006
Sold by
Mick Barry E and Tammy Sue T
Bought by
Mick Barry E S
Current Estimated Value
Home Financials for this Owner
Home Financials are based on the most recent Mortgage that was taken out on this home.
Original Mortgage
$29,100
Interest Rate
6.83%
Mortgage Type
Stand Alone Second
Purchase Details
Closed on
Aug 15, 2006
Sold by
Mick Barry E and Tammy Sue T
Bought by
Mick Barry E S
Home Financials for this Owner
Home Financials are based on the most recent Mortgage that was taken out on this home.
Original Mortgage
$29,100
Interest Rate
6.83%
Mortgage Type
Stand Alone Second
Purchase Details
Closed on
May 13, 2003
Sold by
Mick Barry E
Bought by
Mick Barry E and Mick Tammy Sue
Purchase Details
Closed on
Jan 2, 1996
Sold by
Potter Emmet B
Bought by
Mick Barry E
Create a Home Valuation Report for This Property
The Home Valuation Report is an in-depth analysis detailing your home's value as well as a comparison with similar homes in the area
Home Values in the Area
Average Home Value in this Area
Purchase History
| Date | Buyer | Sale Price | Title Company |
|---|---|---|---|
| Mick Barry E S | -- | -- | |
| Mick Barry E S | -- | -- | |
| Mick Barry E | -- | -- | |
| Mick Barry E | $112,300 | -- |
Source: Public Records
Mortgage History
| Date | Status | Borrower | Loan Amount |
|---|---|---|---|
| Closed | Mick Barry E S | $29,100 | |
| Open | Mick Barry E S | $232,800 | |
| Closed | Mick Barry E S | $232,800 | |
| Closed | Mick Barry E | -- |
Source: Public Records
Tax History Compared to Growth
Tax History
| Year | Tax Paid | Tax Assessment Tax Assessment Total Assessment is a certain percentage of the fair market value that is determined by local assessors to be the total taxable value of land and additions on the property. | Land | Improvement |
|---|---|---|---|---|
| 2025 | $2,911 | $268,867 | $0 | $0 |
| 2024 | $2,822 | $256,600 | $105,500 | $151,100 |
| 2023 | $2,728 | $250,267 | $0 | $0 |
| 2022 | $2,659 | $243,933 | $0 | $0 |
| 2021 | $2,591 | $237,600 | $100,500 | $137,100 |
| 2020 | $2,542 | $233,133 | $0 | $0 |
| 2019 | $2,493 | $228,667 | $0 | $0 |
| 2018 | $2,431 | $224,200 | $95,500 | $128,700 |
| 2017 | $2,381 | $221,167 | $0 | $0 |
| 2016 | $2,364 | $218,133 | $0 | $0 |
| 2015 | $2,364 | $215,100 | $0 | $0 |
| 2014 | $2,364 | $215,100 | $0 | $0 |
Source: Public Records
Map
Nearby Homes
- 35865 Sycamore Ct
- 0 Wicomico Shores Unit MDSM2026932
- 26279 Brazil Dr
- 26000 Sycamore Dr
- 35587 Golf Course Dr
- 26284 White Tail Way
- 35575 Army Navy Dr
- 35406 Golf Course Dr
- 0 Lake Dr
- 35300 Diplomat Dr
- 26319 Chancery Dr
- 26218 Diplomat Cir
- 0 Edgewater Pkwy
- 11090 Creeks Landing Place
- 26400 Hummingbird Way
- 11065 Genevas Place
- 11045 Kingston Place
- 26984 Rita Way
- 26579 Yowaiski Mill Rd
- 27070 Yowaiski Mill Rd
- 36061 Army Navy Dr
- 26097 Hills Dr
- 26105 Hills Dr
- 26095 Hills Dr
- 36071 Army Navy Dr
- 36050 Army Navy Dr
- 26115 Hills Dr
- 26058 Prospect Hill Rd
- 36040 Army Navy Dr
- 36036 Army Navy Dr
- 26087 Hills Dr
- 26125 Hills Dr
- 36087 Army Navy Dr
- 26098 Hills Dr
- 26081 Hills Dr
- 26034 Prospect Hill Rd
- 36026 Army Navy Dr
- 26110 Hills Dr
- 35811 Aviation Yacht Club Rd
- 26096 Hills Dr