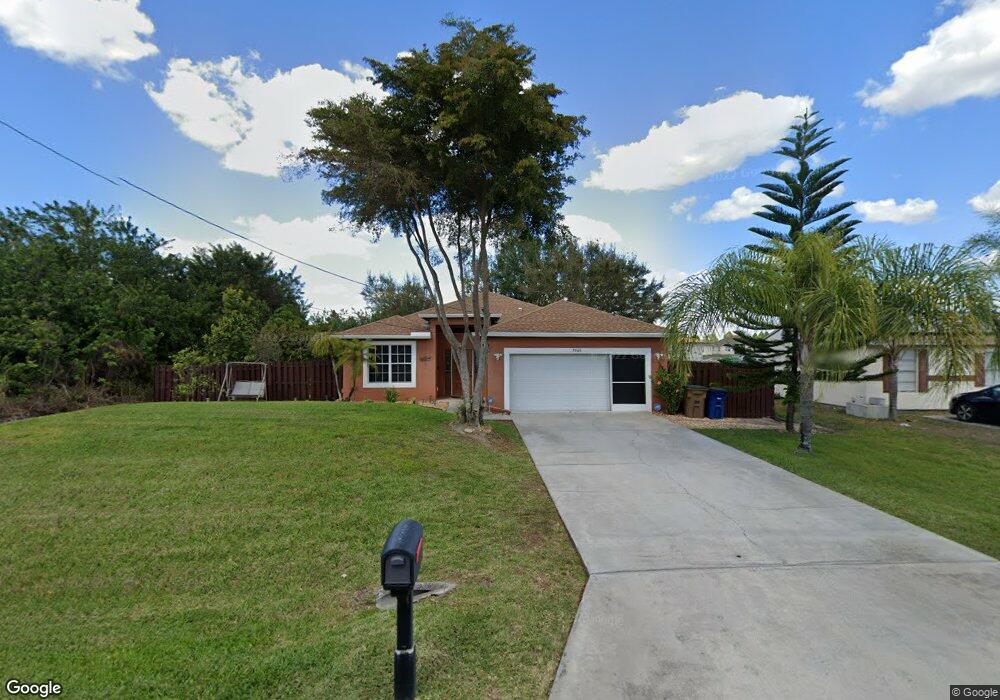
3606 20th St SW Unit 2 Lehigh Acres, FL 33976
Sunshine NeighborhoodEstimated Value: $268,000 - $331,000
3
Beds
2
Baths
1,758
Sq Ft
$168/Sq Ft
Est. Value
About This Home
This home is located at 3606 20th St SW Unit 2, Lehigh Acres, FL 33976 and is currently estimated at $295,741, approximately $168 per square foot. 3606 20th St SW Unit 2 is a home located in Lee County with nearby schools including Gateway Elementary School, Lehigh Elementary School, and Tice Elementary School.
Ownership History
Date
Name
Owned For
Owner Type
Purchase Details
Closed on
Nov 6, 2025
Sold by
Rios Eva A and Brenes Eva A
Bought by
Wagner Brenes and Brenes Eva A
Current Estimated Value
Purchase Details
Closed on
Oct 20, 2025
Sold by
Brenes Wagner and Brenes Eva A
Bought by
Brenes Wagner and Brenes Eva A
Purchase Details
Closed on
Sep 24, 2010
Sold by
Brenes Marco V
Bought by
Brenes Wagner
Purchase Details
Closed on
Apr 1, 2009
Sold by
Wells Fargo Bank Na
Bought by
Brenes Marco V
Purchase Details
Closed on
May 27, 2008
Sold by
Molina Rogelio
Bought by
Aurora Loan Services Inc
Purchase Details
Closed on
Mar 6, 2007
Sold by
L Plus Land Developers Builders Llc
Bought by
Molina Rogelio
Home Financials for this Owner
Home Financials are based on the most recent Mortgage that was taken out on this home.
Original Mortgage
$201,120
Interest Rate
7%
Mortgage Type
Unknown
Purchase Details
Closed on
Jan 18, 2006
Sold by
Lehigh Cape Coral Development Llc
Bought by
L Plus Land Developers/Builders Llc
Purchase Details
Closed on
Mar 9, 2005
Sold by
Baker Edward J and Baker Kathy A
Bought by
Lehigh Cape Coral Development Llc
Create a Home Valuation Report for This Property
The Home Valuation Report is an in-depth analysis detailing your home's value as well as a comparison with similar homes in the area
Home Values in the Area
Average Home Value in this Area
Purchase History
| Date | Buyer | Sale Price | Title Company |
|---|---|---|---|
| Wagner Brenes | $100 | None Listed On Document | |
| Brenes Wagner | $100 | None Listed On Document | |
| Brenes Wagner | -- | None Available | |
| Brenes Marco V | $52,500 | Attorney | |
| Wells Fargo Bank Na | -- | Attorney | |
| Aurora Loan Services Inc | $201,200 | Attorney | |
| Molina Rogelio | $251,400 | Lehigh Title | |
| L Plus Land Developers/Builders Llc | $43,000 | None Available | |
| Lehigh Cape Coral Development Llc | $10,000 | Safe Harbor Title |
Source: Public Records
Mortgage History
| Date | Status | Borrower | Loan Amount |
|---|---|---|---|
| Previous Owner | Molina Rogelio | $201,120 |
Source: Public Records
Tax History Compared to Growth
Tax History
| Year | Tax Paid | Tax Assessment Tax Assessment Total Assessment is a certain percentage of the fair market value that is determined by local assessors to be the total taxable value of land and additions on the property. | Land | Improvement |
|---|---|---|---|---|
| 2025 | $3,351 | $199,346 | -- | -- |
| 2024 | $3,351 | $205,409 | -- | -- |
| 2023 | $3,351 | $256,574 | $15,191 | $232,105 |
| 2022 | $2,160 | $125,530 | $0 | $0 |
| 2021 | $1,884 | $169,107 | $10,244 | $158,863 |
| 2020 | $1,809 | $128,409 | $0 | $0 |
| 2019 | $1,769 | $123,578 | $0 | $0 |
| 2018 | $1,670 | $115,067 | $0 | $0 |
| 2017 | $1,563 | $105,959 | $0 | $0 |
| 2016 | $1,444 | $110,377 | $6,452 | $103,925 |
| 2015 | $1,341 | $96,807 | $5,662 | $91,145 |
| 2014 | -- | $81,500 | $5,048 | $76,452 |
| 2013 | -- | $67,997 | $4,841 | $63,156 |
Source: Public Records
Map
Nearby Homes
- 3608 19th St SW
- 3604 21st St SW
- 1505 Unice Ave S
- 3617 19th St SW
- 3816 20th St SW
- 4001 20th St SW
- 3602 20th St SW
- 3517 20th St SW
- 3206 20th St SW
- 3515 20th St SW
- 3510 21st St SW
- 3511 20th St SW
- 3914 21st St SW
- 3803 22nd St SW
- 3709 22nd St SW
- 3220 22nd St SW
- 4002 22nd St SW
- 3602 17th St SW
- 3508 22nd St SW
- 2822 20th St SW
- 3604 20th St SW
- 3610 20th St SW
- 3603 20th St SW Unit 2
- 3609 19th St SW
- 2910 19th St SW Unit 13
- 3601 19th St SW
- 2809 19th St SW
- 4100 19th St SW
- 2925 19th St SW
- 3700 19th St SW
- 3408 19th St SW
- 3511 19th St SW
- 3517 19th St SW
- 4305 19th St SW
- 3215 19th St SW
- 4307 19th St SW
- 3612 20th St SW
- 3609 20th St SW Unit 2
- 3419 20th St SW
- 3611 19th St SW