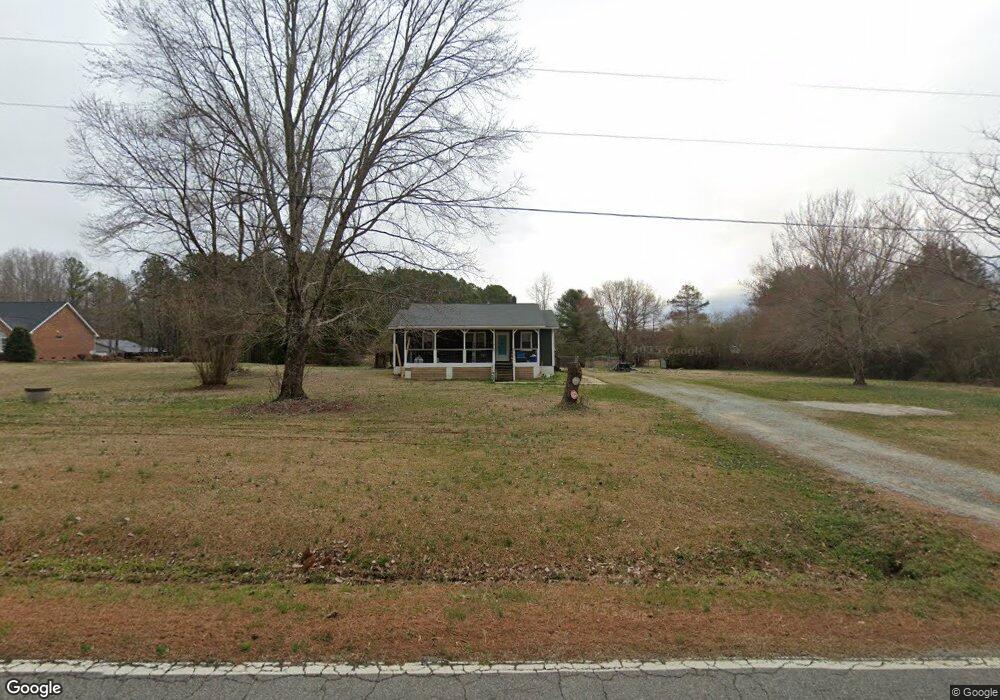
3606 Bahama Rd Rougemont, NC 27572
Estimated Value: $225,767 - $458,000
3
Beds
1
Bath
1,064
Sq Ft
$293/Sq Ft
Est. Value
About This Home
This home is located at 3606 Bahama Rd, Rougemont, NC 27572 and is currently estimated at $312,192, approximately $293 per square foot. 3606 Bahama Rd is a home located in Durham County with nearby schools including Mangum Elementary School, Lucas Middle School, and Northern High School.
Ownership History
Date
Name
Owned For
Owner Type
Purchase Details
Closed on
Jul 18, 2025
Sold by
Smith Elmer F
Bought by
Wyckoff Kara S and Wyckoff John A
Current Estimated Value
Purchase Details
Closed on
Jul 17, 2025
Sold by
Wyckoff John A and Wyckoff Kara S
Bought by
Smith Elmer F
Purchase Details
Closed on
Nov 17, 2004
Sold by
Ladd Joseph S and Ladd Lora
Bought by
Wyckoff John A and Wyckoff Kara S
Home Financials for this Owner
Home Financials are based on the most recent Mortgage that was taken out on this home.
Original Mortgage
$92,800
Interest Rate
5%
Mortgage Type
Purchase Money Mortgage
Purchase Details
Closed on
Sep 10, 2003
Sold by
Mangum Millard C and Mangum Beverly T
Bought by
Jackson Randy and Jackson Kimberly
Home Financials for this Owner
Home Financials are based on the most recent Mortgage that was taken out on this home.
Original Mortgage
$195,000
Interest Rate
4.25%
Mortgage Type
Construction
Purchase Details
Closed on
Feb 25, 2000
Sold by
Wilson Mark V and Wilson Lori
Bought by
Ladd Joseph S and Ladd Donna F
Home Financials for this Owner
Home Financials are based on the most recent Mortgage that was taken out on this home.
Original Mortgage
$91,066
Interest Rate
8.21%
Mortgage Type
FHA
Create a Home Valuation Report for This Property
The Home Valuation Report is an in-depth analysis detailing your home's value as well as a comparison with similar homes in the area
Home Values in the Area
Average Home Value in this Area
Purchase History
| Date | Buyer | Sale Price | Title Company |
|---|---|---|---|
| Wyckoff Kara S | -- | None Listed On Document | |
| Smith Elmer F | -- | None Listed On Document | |
| Smith Elmer F | -- | None Listed On Document | |
| Wyckoff John A | $116,000 | -- | |
| Jackson Randy | $35,000 | -- | |
| Ladd Joseph S | $97,000 | -- |
Source: Public Records
Mortgage History
| Date | Status | Borrower | Loan Amount |
|---|---|---|---|
| Previous Owner | Wyckoff John A | $92,800 | |
| Previous Owner | Jackson Randy | $195,000 | |
| Previous Owner | Ladd Joseph S | $91,066 | |
| Closed | Wyckoff John A | $23,200 |
Source: Public Records
Tax History Compared to Growth
Tax History
| Year | Tax Paid | Tax Assessment Tax Assessment Total Assessment is a certain percentage of the fair market value that is determined by local assessors to be the total taxable value of land and additions on the property. | Land | Improvement |
|---|---|---|---|---|
| 2025 | $1,556 | $199,101 | $50,160 | $148,941 |
| 2024 | $1,386 | $126,585 | $35,020 | $91,565 |
| 2023 | $1,311 | $126,585 | $35,020 | $91,565 |
| 2022 | $1,252 | $126,585 | $35,020 | $91,565 |
| 2021 | $1,039 | $126,585 | $35,020 | $91,565 |
| 2020 | $1,026 | $126,585 | $35,020 | $91,565 |
| 2019 | $1,026 | $126,585 | $35,020 | $91,565 |
| 2018 | $969 | $110,561 | $25,020 | $85,541 |
| 2017 | $958 | $110,561 | $25,020 | $85,541 |
| 2016 | $928 | $110,561 | $25,020 | $85,541 |
| 2015 | $1,091 | $106,704 | $21,298 | $85,406 |
| 2014 | $1,091 | $106,704 | $21,298 | $85,406 |
Source: Public Records
Map
Nearby Homes
- 9 Piney Grove Rd
- 4209 Hall Rd
- 9418 Wilkins Rd
- 2819 Ellis Chapel Rd
- 44 Blazing Star Ln
- 18 Indian Pipe Trail
- 10 Indian Pipe Trail
- 1502 Bahama Rd
- 8509 Stagville Rd
- 9841 Quail Roost Rd
- 10418 Stallion Way
- 10304 Stallion Way
- 10 Pony Ct
- 309 Appaloosa Trail
- 404 Phar Lap Ln
- 10620 N Roxboro Rd
- 1270 Moores Mill Rd
- 1403 Moores Mill Rd
- 8011 Old Trail Dr
- 418 Quail Roost Farm Rd