3606 Cedar Cir Unit 3606 Powell, OH 43065
Liberty Township NeighborhoodEstimated Value: $109,000 - $319,000
3
Beds
2
Baths
1,607
Sq Ft
$152/Sq Ft
Est. Value
About This Home
This home is located at 3606 Cedar Cir Unit 3606, Powell, OH 43065 and is currently estimated at $243,667, approximately $151 per square foot. 3606 Cedar Cir Unit 3606 is a home located in Delaware County with nearby schools including Scioto Ridge Elementary School, Olentangy Liberty Middle School, and Olentangy Liberty High School.
Ownership History
Date
Name
Owned For
Owner Type
Purchase Details
Closed on
May 29, 2025
Sold by
Coffield Harry T and Coffield Elenore I
Bought by
Mramor Alex and Mramor Collectively Victoria
Current Estimated Value
Home Financials for this Owner
Home Financials are based on the most recent Mortgage that was taken out on this home.
Original Mortgage
$258,480
Outstanding Balance
$257,819
Interest Rate
6.83%
Mortgage Type
New Conventional
Estimated Equity
-$14,152
Purchase Details
Closed on
Jan 13, 2006
Sold by
Lovell Jack L
Bought by
Borin Lois A
Purchase Details
Closed on
Jun 30, 2003
Sold by
Zimmer Janet L
Bought by
Lovell Jack and Lovell Myrta
Purchase Details
Closed on
Apr 1, 1998
Sold by
Village Communities Corp
Bought by
Zimmer Janet L
Home Financials for this Owner
Home Financials are based on the most recent Mortgage that was taken out on this home.
Original Mortgage
$108,700
Interest Rate
7.09%
Mortgage Type
New Conventional
Create a Home Valuation Report for This Property
The Home Valuation Report is an in-depth analysis detailing your home's value as well as a comparison with similar homes in the area
Home Values in the Area
Average Home Value in this Area
Purchase History
| Date | Buyer | Sale Price | Title Company |
|---|---|---|---|
| Mramor Alex | $107,700 | Search2close | |
| Borin Lois A | -- | None Available | |
| Lovell Jack | $149,000 | Multiple | |
| Zimmer Janet L | $135,900 | -- |
Source: Public Records
Mortgage History
| Date | Status | Borrower | Loan Amount |
|---|---|---|---|
| Open | Mramor Alex | $258,480 | |
| Previous Owner | Zimmer Janet L | $108,700 |
Source: Public Records
Tax History Compared to Growth
Tax History
| Year | Tax Paid | Tax Assessment Tax Assessment Total Assessment is a certain percentage of the fair market value that is determined by local assessors to be the total taxable value of land and additions on the property. | Land | Improvement |
|---|---|---|---|---|
| 2024 | $4,048 | $87,050 | $15,750 | $71,300 |
| 2023 | $4,097 | $87,050 | $15,750 | $71,300 |
| 2022 | $4,359 | $74,450 | $13,650 | $60,800 |
| 2021 | $4,385 | $74,450 | $13,650 | $60,800 |
| 2020 | $4,407 | $74,450 | $13,650 | $60,800 |
| 2019 | $3,193 | $58,380 | $10,500 | $47,880 |
| 2018 | $3,208 | $58,380 | $10,500 | $47,880 |
| 2017 | $3,174 | $46,590 | $9,450 | $37,140 |
| 2016 | $2,603 | $46,590 | $9,450 | $37,140 |
| 2015 | $2,899 | $46,590 | $9,450 | $37,140 |
| 2014 | $2,939 | $46,590 | $9,450 | $37,140 |
| 2013 | $2,936 | $45,500 | $9,450 | $36,050 |
Source: Public Records
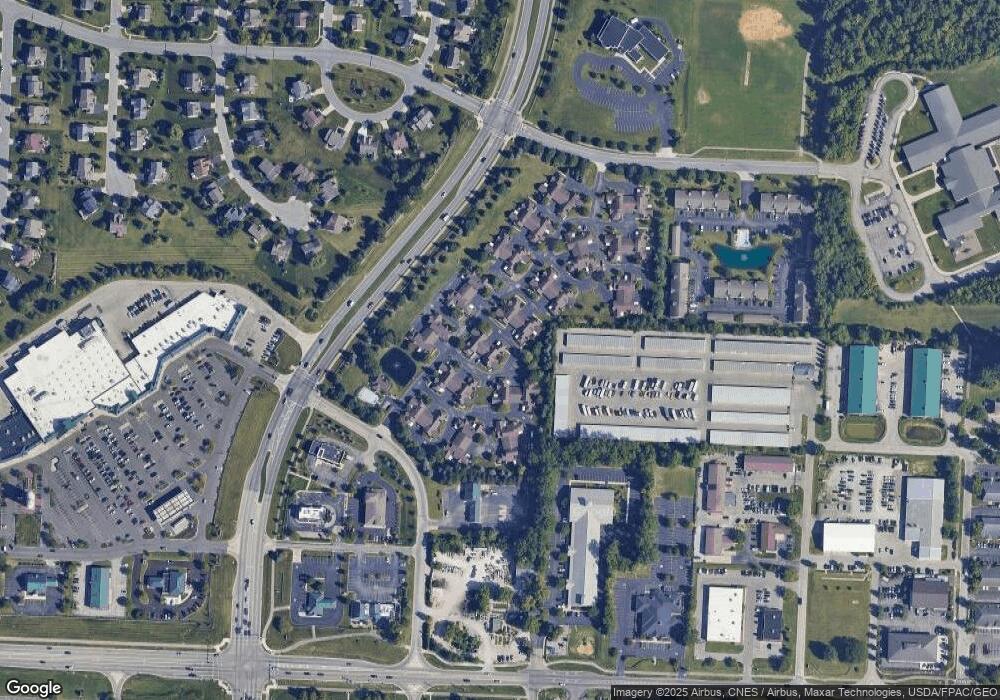
Map
Nearby Homes
- 9406 Cadogan Ct
- 4162 Pyke Dr
- 9182 Marlebury End
- 3899 Hampshire Ave
- 384 Park Woods Ln
- 348 Park Woods Ln
- 324 Park Woods Ln
- 409 Charles Spring Dr
- 3585 Orchard Way
- 87 Murphys Oval Unit N87
- 3580 Perennial Ln
- 9529 Wayne Brown Dr
- 3801 Orchard Way
- 114 Encore Park Bend
- Oakley Plan at Encore Park of Powell - Uptown Collection
- Irving Plan at Encore Park of Powell - Uptown Collection
- 110 Encore Park Bend
- 255 Winter Hill Place
- 7356 Celebration Dr
- 3750 Echo Place Unit 3750
- 3650 Cedar Cir Unit 3650
- 3604 Cedar Cir
- 3652 Cedar Cir
- 3617 Cedar Cir
- 3615 Cedar Cir
- 3635 Cedar Cir
- 9437 Clermont Blvd Unit 9437
- 0 Clermont Blvd Unit 3675
- 3633 Cedar Cir Unit 3633
- 3655 Cedar Cir Unit 3655
- 3638 Osprey Ln
- 3657 Cedar Cir
- 9472 Clermont Blvd Unit 9472
- 3636 Osprey Ln Unit 3636
- 3672 Osprey Ln Unit 3672
- 9431 Clermont Blvd
- 3674 Osprey Ln Unit 3674
- 9433 Clermont Blvd
- 9464 Clermont Blvd Unit 9464
- 9474 Clermont Blvd