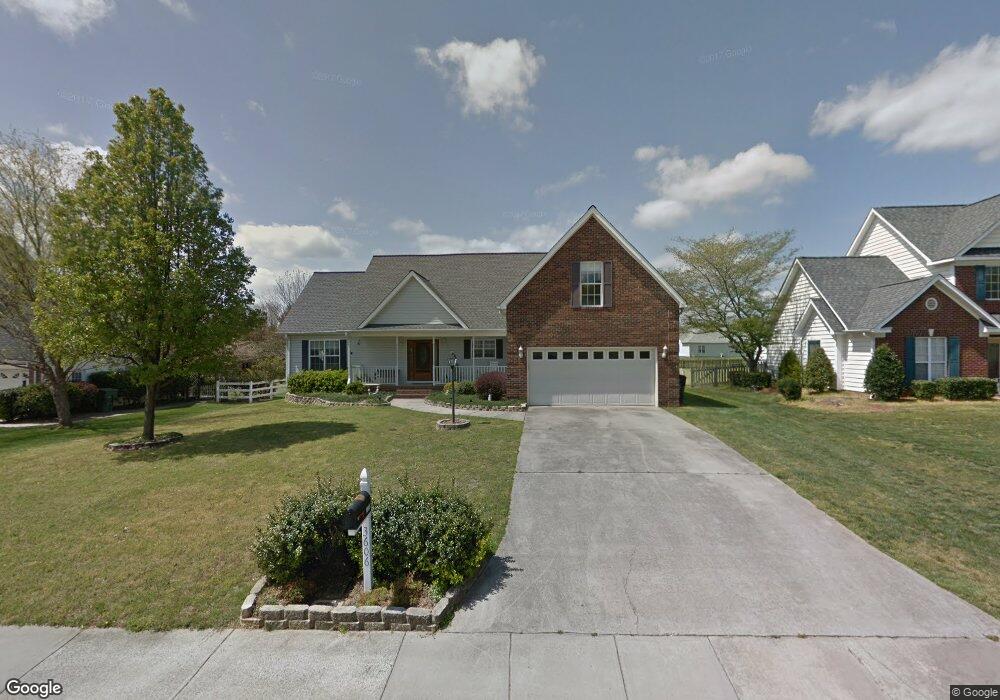
3606 Cedar Springs Dr SW Concord, NC 28027
Estimated Value: $371,000 - $421,000
3
Beds
2
Baths
1,883
Sq Ft
$216/Sq Ft
Est. Value
About This Home
This home is located at 3606 Cedar Springs Dr SW, Concord, NC 28027 and is currently estimated at $406,291, approximately $215 per square foot. 3606 Cedar Springs Dr SW is a home located in Cabarrus County with nearby schools including Wolf Meadow Elementary School, Roberta Road Middle School, and Jay M. Robinson High School.
Ownership History
Date
Name
Owned For
Owner Type
Purchase Details
Closed on
May 5, 2022
Sold by
Paul Southworth R and Paul Kathleen F
Bought by
Paul Southworth R and Paul Southworth R
Current Estimated Value
Purchase Details
Closed on
Apr 28, 2000
Sold by
Perkins William D and Perkins Susan C
Bought by
Southworth R Paul and Southworth Kathleen F
Home Financials for this Owner
Home Financials are based on the most recent Mortgage that was taken out on this home.
Original Mortgage
$78,000
Interest Rate
7.75%
Purchase Details
Closed on
Oct 5, 1999
Sold by
The King Corp Of Charlotte Inc
Bought by
Perkins William D
Home Financials for this Owner
Home Financials are based on the most recent Mortgage that was taken out on this home.
Original Mortgage
$28,000
Interest Rate
7.79%
Mortgage Type
Construction
Create a Home Valuation Report for This Property
The Home Valuation Report is an in-depth analysis detailing your home's value as well as a comparison with similar homes in the area
Home Values in the Area
Average Home Value in this Area
Purchase History
| Date | Buyer | Sale Price | Title Company |
|---|---|---|---|
| Paul Southworth R | -- | Elder Law & Estate Planning So | |
| Southworth R Paul | $155,000 | -- | |
| Perkins William D | $28,000 | -- |
Source: Public Records
Mortgage History
| Date | Status | Borrower | Loan Amount |
|---|---|---|---|
| Previous Owner | Southworth R Paul | $78,000 | |
| Previous Owner | Perkins William D | $28,000 |
Source: Public Records
Tax History Compared to Growth
Tax History
| Year | Tax Paid | Tax Assessment Tax Assessment Total Assessment is a certain percentage of the fair market value that is determined by local assessors to be the total taxable value of land and additions on the property. | Land | Improvement |
|---|---|---|---|---|
| 2025 | $3,772 | $378,710 | $80,000 | $298,710 |
| 2024 | $3,772 | $378,710 | $80,000 | $298,710 |
| 2023 | $2,674 | $219,140 | $45,000 | $174,140 |
| 2022 | $2,674 | $219,140 | $45,000 | $174,140 |
| 2021 | $2,674 | $219,140 | $45,000 | $174,140 |
| 2020 | $2,674 | $219,140 | $45,000 | $174,140 |
| 2019 | $2,275 | $186,510 | $30,000 | $156,510 |
| 2018 | $2,238 | $186,510 | $30,000 | $156,510 |
| 2017 | $2,201 | $186,510 | $30,000 | $156,510 |
| 2016 | $1,306 | $180,810 | $30,000 | $150,810 |
| 2015 | $2,134 | $180,810 | $30,000 | $150,810 |
| 2014 | $2,134 | $180,810 | $30,000 | $150,810 |
Source: Public Records
Map
Nearby Homes
- 3811 Bent Creek Dr SW
- 3807 Bent Creek Dr SW
- 3333 Roberta Rd
- 3455 Roberta Rd
- 3369 Roberta Rd
- 5366 Hardister Place
- 3141 Yates Mill Dr SW
- 3913 Stough Rd
- 3133 Roberta Rd
- 4370 Coddle Creek Dr
- 4349 Roberta Rd
- 4104 Pebblebrook Cir SW
- 3011 Langhorne Ave SW
- 4114 Carolina Pointe Ct SW
- 3673 Farm Lake Dr SW
- 1398 Kent Downs Ave SW Unit 52
- 4112 Alexis Ct SW
- 706 King Fredrick Ln SW
- 3174 Farmwood Blvd SW Unit 154
- 2694 Woodcrest Dr SW
- 3610 Cedar Springs Dr SW
- 3602 Cedar Springs Dr SW
- 3614 Cedar Springs Dr SW
- 3721 Bentley Place SW
- 3598 Cedar Springs Dr SW
- 3717 Bentley Place SW
- 3725 Bentley Place SW
- 3603R Cedar Springs Dr SW
- 3713 Bentley Place SW
- 3607 Cedar Springs Dr SW
- 3618 Cedar Springs Dr SW
- 3611 Cedar Springs Dr SW
- 3603 Cedar Springs Dr SW
- 3615 Cedar Springs Dr SW
- 3729 Bentley Place SW
- 3622 Cedar Springs Dr SW
- 3593 Cedar Springs Dr SW
- 3619 Cedar Springs Dr SW
- 3588 Cedar Springs Dr SW
- 3705 Bentley Place SW