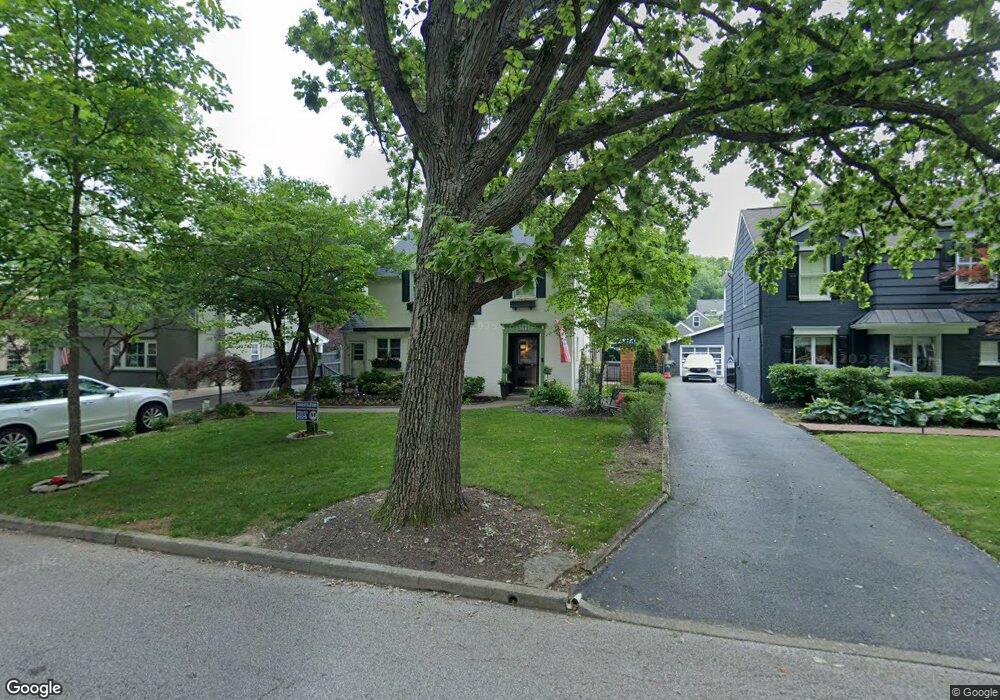
3606 Flintpoint Way Cincinnati, OH 45227
Estimated Value: $733,767 - $894,000
4
Beds
2
Baths
1,938
Sq Ft
$420/Sq Ft
Est. Value
About This Home
This home is located at 3606 Flintpoint Way, Cincinnati, OH 45227 and is currently estimated at $813,692, approximately $419 per square foot. 3606 Flintpoint Way is a home located in Hamilton County with nearby schools including Terrace Park Elementary School, Mariemont Elementary School, and Mariemont High School.
Ownership History
Date
Name
Owned For
Owner Type
Purchase Details
Closed on
Feb 21, 2008
Sold by
Reed Andrew J and Reed Melissa
Bought by
Karlson David H and Karlson Bridgitt C
Current Estimated Value
Home Financials for this Owner
Home Financials are based on the most recent Mortgage that was taken out on this home.
Original Mortgage
$348,000
Interest Rate
6.1%
Mortgage Type
Unknown
Purchase Details
Closed on
Jul 5, 2005
Sold by
Rosen Brian and Rosen Tammy
Bought by
Reed Andrew J
Home Financials for this Owner
Home Financials are based on the most recent Mortgage that was taken out on this home.
Original Mortgage
$315,900
Interest Rate
5.37%
Mortgage Type
Unknown
Purchase Details
Closed on
Nov 12, 1995
Sold by
Everitt Dorothy Coriell
Bought by
Rosen Brian and Rosen Tammy
Home Financials for this Owner
Home Financials are based on the most recent Mortgage that was taken out on this home.
Original Mortgage
$126,000
Interest Rate
7.65%
Create a Home Valuation Report for This Property
The Home Valuation Report is an in-depth analysis detailing your home's value as well as a comparison with similar homes in the area
Home Values in the Area
Average Home Value in this Area
Purchase History
| Date | Buyer | Sale Price | Title Company |
|---|---|---|---|
| Karlson David H | $348,000 | Cornerstone Title Svcs Llc | |
| Reed Andrew J | -- | None Available | |
| Rosen Brian | -- | -- |
Source: Public Records
Mortgage History
| Date | Status | Borrower | Loan Amount |
|---|---|---|---|
| Previous Owner | Karlson David H | $348,000 | |
| Previous Owner | Reed Andrew J | $315,900 | |
| Previous Owner | Rosen Brian | $126,000 |
Source: Public Records
Tax History
| Year | Tax Paid | Tax Assessment Tax Assessment Total Assessment is a certain percentage of the fair market value that is determined by local assessors to be the total taxable value of land and additions on the property. | Land | Improvement |
|---|---|---|---|---|
| 2025 | $13,204 | $187,429 | $97,675 | $89,754 |
| 2024 | $12,911 | $187,429 | $97,675 | $89,754 |
| 2023 | $11,905 | $187,429 | $97,675 | $89,754 |
| 2022 | $13,771 | $183,702 | $78,628 | $105,074 |
| 2021 | $13,445 | $183,702 | $78,628 | $105,074 |
| 2020 | $13,579 | $183,702 | $78,628 | $105,074 |
| 2019 | $13,057 | $161,140 | $68,971 | $92,169 |
| 2018 | $13,052 | $161,140 | $68,971 | $92,169 |
| 2017 | $11,111 | $161,140 | $68,971 | $92,169 |
| 2016 | $9,452 | $135,619 | $58,370 | $77,249 |
| 2015 | $9,550 | $135,619 | $58,370 | $77,249 |
| 2014 | $9,559 | $135,619 | $58,370 | $77,249 |
| 2013 | $8,359 | $124,422 | $53,550 | $70,872 |
Source: Public Records
Map
Nearby Homes
- 3817 Indianview Ave
- 3766 Miami Run
- 3746 Miami Run
- 3763 Miami Run
- 3767 Miami Run
- 3750 Miami Run
- 3969 Miami Rd
- 3758 Miami Run
- 3771 Miami Run
- 3754 Miami Run
- 3762 Miami Run
- 6949 Cambridge Ave
- 6307 Wooster Pike
- 3662 Birkdale Ln
- 3645 Birkdale Ln
- 3641 Birkdale Ln
- 3653 Birkdale Ln
- 3657 Birkdale Ln
- 3649 Birkdale Ln
- 3665 Birkdale Ln
- 3604 Flintpoint Way
- 3608 Flintpoint Way
- 3610 Flintpoint Way
- 3607 Center St
- 3602 Flintpoint Way
- 3605 Center St
- 3609 Center St
- 3603 Center St
- 6826 Hammerstone Way
- 6827 Mount Vernon Ave
- 3600 Flintpoint Way
- 3607 Flintpoint Way
- 6831 Mount Vernon Ave
- 6829 Hammerstone Way
- 3609 Flintpoint Way
- 3601 Center St
- 3598 Flintpoint Way
- 3601 Flintpoint Way
- 6817 Mount Vernon Ave
- 6824 Hammerstone Way
Your Personal Tour Guide
Ask me questions while you tour the home.