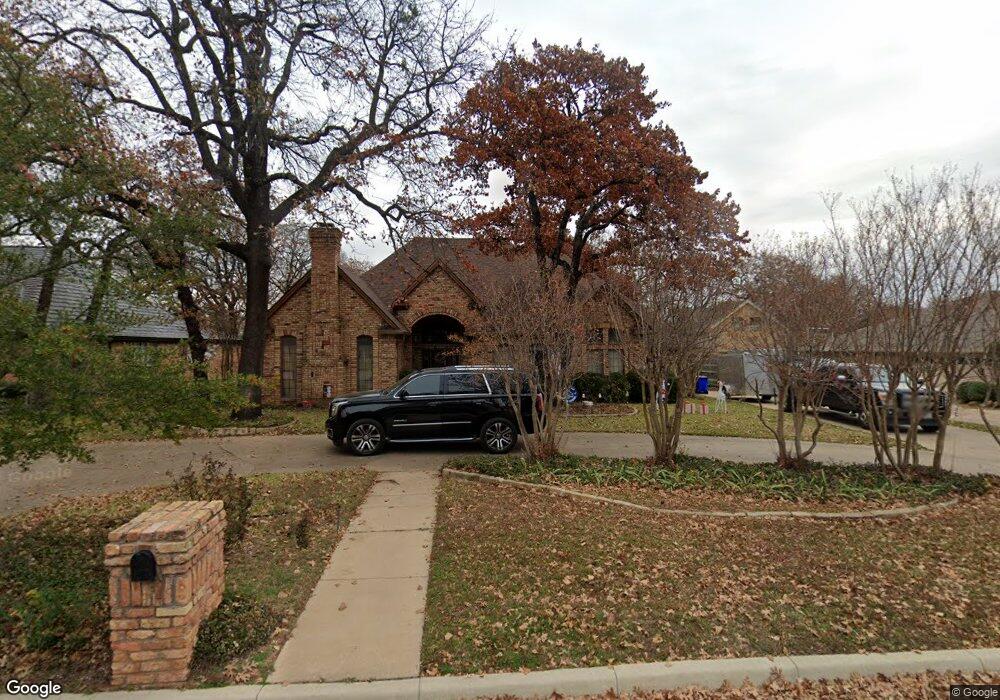
3607 Cliffwood Dr Colleyville, TX 76034
Estimated Value: $690,770 - $725,000
4
Beds
4
Baths
3,083
Sq Ft
$230/Sq Ft
Est. Value
About This Home
This home is located at 3607 Cliffwood Dr, Colleyville, TX 76034 and is currently estimated at $708,943, approximately $229 per square foot. 3607 Cliffwood Dr is a home located in Tarrant County with nearby schools including Bedford Heights Elementary School, Bedford Junior High School, and L.D. Bell High School.
Ownership History
Date
Name
Owned For
Owner Type
Purchase Details
Closed on
Sep 19, 2014
Sold by
Ladd Natalya V and Anderson Natalya V
Bought by
Ladd Natalya and Ladd Alan
Current Estimated Value
Home Financials for this Owner
Home Financials are based on the most recent Mortgage that was taken out on this home.
Original Mortgage
$207,800
Outstanding Balance
$114,758
Interest Rate
4.14%
Mortgage Type
New Conventional
Estimated Equity
$594,185
Purchase Details
Closed on
Sep 18, 2007
Sold by
Whittenberg Ira O and Whittenberg Emma Jo
Bought by
Anderson Natalyn
Home Financials for this Owner
Home Financials are based on the most recent Mortgage that was taken out on this home.
Original Mortgage
$273,600
Interest Rate
6.63%
Mortgage Type
Purchase Money Mortgage
Create a Home Valuation Report for This Property
The Home Valuation Report is an in-depth analysis detailing your home's value as well as a comparison with similar homes in the area
Home Values in the Area
Average Home Value in this Area
Purchase History
| Date | Buyer | Sale Price | Title Company |
|---|---|---|---|
| Ladd Natalya | -- | None Available | |
| Anderson Natalyn | -- | Rattikin Title |
Source: Public Records
Mortgage History
| Date | Status | Borrower | Loan Amount |
|---|---|---|---|
| Open | Ladd Natalya | $207,800 | |
| Closed | Anderson Natalyn | $273,600 |
Source: Public Records
Tax History Compared to Growth
Tax History
| Year | Tax Paid | Tax Assessment Tax Assessment Total Assessment is a certain percentage of the fair market value that is determined by local assessors to be the total taxable value of land and additions on the property. | Land | Improvement |
|---|---|---|---|---|
| 2025 | $7,134 | $496,000 | $120,000 | $376,000 |
| 2024 | $7,134 | $593,000 | $120,000 | $473,000 |
| 2023 | $7,888 | $605,000 | $100,000 | $505,000 |
| 2022 | $9,577 | $550,776 | $100,000 | $450,776 |
| 2021 | $9,317 | $445,563 | $100,000 | $345,563 |
| 2020 | $9,422 | $445,563 | $100,000 | $345,563 |
| 2019 | $8,861 | $447,988 | $100,000 | $347,988 |
| 2018 | $6,492 | $368,103 | $100,000 | $268,103 |
| 2017 | $7,636 | $334,639 | $35,000 | $299,639 |
| 2016 | $7,636 | $334,639 | $35,000 | $299,639 |
| 2015 | $7,105 | $308,000 | $34,651 | $273,349 |
| 2014 | $7,105 | $311,100 | $35,000 | $276,100 |
Source: Public Records
Map
Nearby Homes
- 3713 Brentwood Ct
- 305 Warbler Dr
- 2620 Brookridge Dr
- 405 Woodbriar Ct
- 404 Heather Ln
- 320 Blue Quail Ct
- 2732 Woodbridge Dr
- 2244 Hurstview Dr
- 2212 Mountainview Dr
- 2212 Hurstview Dr
- 2668 Bent Tree Dr
- 628 Huntwich Dr
- 3605 Spring Valley Dr
- 712 Springwood Dr
- 2844 Hurstview Dr
- 421 Cavender Ct
- 3213 Spring Valley Dr
- 2804 Ridgewood Dr
- 405 Bremen Dr
- 909 Brestol Ct W
- 3609 Cliffwood Dr
- 3601 Cliffwood Dr
- 3604 San Bar Ln
- 3608 San Bar Ln
- 3600 San Bar Ln
- 3611 Cliffwood Dr
- 3608 Cliffwood Dr
- 3511 Cliffwood Dr
- 3604 Cliffwood Dr
- 3612 San Bar Ln
- 3600 Cliffwood Dr
- 3615 Cliffwood Dr
- 3616 San Bar Ln
- 3512 Cliffwood Dr
- 3512 Cliffwood Dr
- 3616 Cliffwood Dr
- 3609 Woodcrest Ct
- 3605 Woodcrest Ct
- 3509 Cliffwood Dr
- 3601 Woodcrest Ct