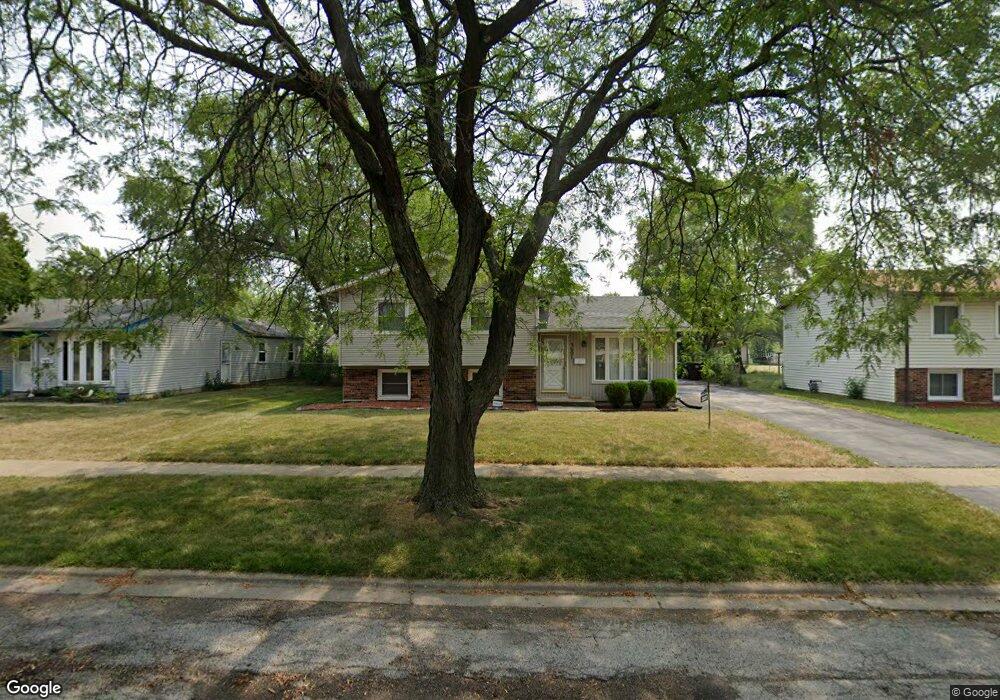
3607 Peach Grove Ln Hazel Crest, IL 60429
Estimated Value: $205,000 - $236,000
3
Beds
2
Baths
1,499
Sq Ft
$149/Sq Ft
Est. Value
About This Home
This home is located at 3607 Peach Grove Ln, Hazel Crest, IL 60429 and is currently estimated at $223,520, approximately $149 per square foot. 3607 Peach Grove Ln is a home located in Cook County with nearby schools including Highlands Elementary School, Prairie-Hills Junior High School, and Hillcrest High School.
Ownership History
Date
Name
Owned For
Owner Type
Purchase Details
Closed on
Dec 6, 2001
Sold by
Adams Steven
Bought by
Armstrong Carolyn T and Armstrong Adams Carolyn T
Current Estimated Value
Purchase Details
Closed on
Sep 16, 1998
Sold by
Brunson Robert D and Brunson Angela M
Bought by
Adams Steven and Armstrong Adams Carolyn T
Home Financials for this Owner
Home Financials are based on the most recent Mortgage that was taken out on this home.
Original Mortgage
$87,750
Outstanding Balance
$18,940
Interest Rate
7.02%
Estimated Equity
$204,580
Purchase Details
Closed on
Aug 8, 1995
Sold by
Pierce Samuel L and Pierce Lori A
Bought by
Brunson Robert D and Brunson Angela M
Home Financials for this Owner
Home Financials are based on the most recent Mortgage that was taken out on this home.
Original Mortgage
$82,450
Interest Rate
7.64%
Create a Home Valuation Report for This Property
The Home Valuation Report is an in-depth analysis detailing your home's value as well as a comparison with similar homes in the area
Home Values in the Area
Average Home Value in this Area
Purchase History
| Date | Buyer | Sale Price | Title Company |
|---|---|---|---|
| Armstrong Carolyn T | -- | -- | |
| Adams Steven | $90,500 | -- | |
| Brunson Robert D | $87,000 | -- |
Source: Public Records
Mortgage History
| Date | Status | Borrower | Loan Amount |
|---|---|---|---|
| Open | Adams Steven | $87,750 | |
| Previous Owner | Brunson Robert D | $82,450 |
Source: Public Records
Tax History Compared to Growth
Tax History
| Year | Tax Paid | Tax Assessment Tax Assessment Total Assessment is a certain percentage of the fair market value that is determined by local assessors to be the total taxable value of land and additions on the property. | Land | Improvement |
|---|---|---|---|---|
| 2024 | $7,522 | $18,000 | $2,616 | $15,384 |
| 2023 | $5,747 | $18,000 | $2,616 | $15,384 |
| 2022 | $5,747 | $11,249 | $2,243 | $9,006 |
| 2021 | $5,602 | $11,248 | $2,242 | $9,006 |
| 2020 | $5,472 | $11,248 | $2,242 | $9,006 |
| 2019 | $4,597 | $10,295 | $2,055 | $8,240 |
| 2018 | $4,451 | $10,295 | $2,055 | $8,240 |
| 2017 | $4,195 | $10,295 | $2,055 | $8,240 |
| 2016 | $4,128 | $9,557 | $1,868 | $7,689 |
| 2015 | $3,884 | $9,557 | $1,868 | $7,689 |
| 2014 | $3,818 | $9,557 | $1,868 | $7,689 |
| 2013 | $3,975 | $10,929 | $1,868 | $9,061 |
Source: Public Records
Map
Nearby Homes
- 3512 Woodworth Place
- 3618 Peach Grove Ln
- 17316 Central Park Ave
- 17303 Appletree Dr
- 3500 Maple Ln
- 17206 Elm Dr
- 3806 172nd St
- 3800 171st St
- 17004 Locust Dr
- 17113 Elm Dr
- 3317 Woodworth Place
- 3881 171st St
- 3509 Birchwood Dr
- 3312 Maple Ln
- 3324 Laurel Ln
- 17306 Burr Oak Ln
- 17126 Orchard Ln
- 3425 Birchwood Dr
- 17007 Elm Dr
- 17311 Burr Oak Ln
- 3609 Peach Grove Ln
- 3605 Peach Grove Ln
- 3606 Tamarind Ln
- 3611 Peach Grove Ln Unit 2
- 3608 Tamarind Ln
- 3604 Tamarind Ln
- 3610 Tamarind Ln
- 3606 Peach Grove Ln
- 3604 Peach Grove Ln
- 3613 Peach Grove Ln
- 3608 Peach Grove Ln
- 3602 Peach Grove Ln
- 17214 Springtide Ln
- 3612 Tamarind Ln
- 17203 Springtide Ln
- 17205 Springtide Ln
- 3610 Peach Grove Ln
- 17207 Springtide Ln
- 17201 Springtide Ln
- 3615 Peach Grove Ln