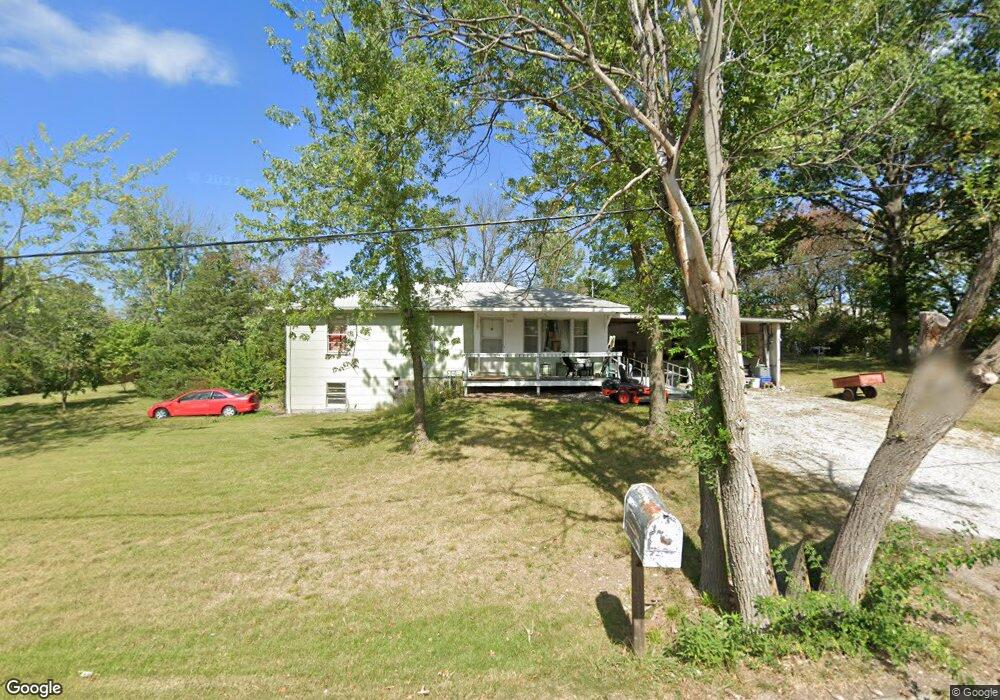
3607 Rutledge Dr Columbia, MO 65202
Estimated Value: $172,000 - $262,000
3
Beds
2
Baths
1,639
Sq Ft
$140/Sq Ft
Est. Value
About This Home
This home is located at 3607 Rutledge Dr, Columbia, MO 65202 and is currently estimated at $229,230, approximately $139 per square foot. 3607 Rutledge Dr is a home located in Boone County with nearby schools including Alpha Hart Lewis Elementary School, John B. Lange Middle School, and Muriel W. Battle High School.
Ownership History
Date
Name
Owned For
Owner Type
Purchase Details
Closed on
Oct 27, 2023
Sold by
Quisenberry Richard and Quisenberry Peggy
Bought by
Mcdow Billy
Current Estimated Value
Purchase Details
Closed on
Oct 20, 2016
Sold by
Jackson Jerry and Jackson Carol
Bought by
Quisenberry Richard and Quisenberry Peggy
Purchase Details
Closed on
Apr 19, 2011
Sold by
Quisenberry Richard and Quisenberry Peggy
Bought by
Jackson Jerry and Jackson Carol
Home Financials for this Owner
Home Financials are based on the most recent Mortgage that was taken out on this home.
Original Mortgage
$49,500
Interest Rate
4.91%
Mortgage Type
Purchase Money Mortgage
Purchase Details
Closed on
Mar 30, 2011
Sold by
Quisenberry Nadine Pearl
Bought by
Quisenberry Richard and Quisenberry Peggy
Home Financials for this Owner
Home Financials are based on the most recent Mortgage that was taken out on this home.
Original Mortgage
$49,500
Interest Rate
4.91%
Mortgage Type
Purchase Money Mortgage
Create a Home Valuation Report for This Property
The Home Valuation Report is an in-depth analysis detailing your home's value as well as a comparison with similar homes in the area
Home Values in the Area
Average Home Value in this Area
Purchase History
| Date | Buyer | Sale Price | Title Company |
|---|---|---|---|
| Mcdow Billy | -- | Boone Central Title | |
| Quisenberry Richard | $49,500 | None Available | |
| Jackson Jerry | -- | None Available | |
| Quisenberry Richard | -- | None Available |
Source: Public Records
Mortgage History
| Date | Status | Borrower | Loan Amount |
|---|---|---|---|
| Previous Owner | Jackson Jerry | $49,500 |
Source: Public Records
Tax History Compared to Growth
Tax History
| Year | Tax Paid | Tax Assessment Tax Assessment Total Assessment is a certain percentage of the fair market value that is determined by local assessors to be the total taxable value of land and additions on the property. | Land | Improvement |
|---|---|---|---|---|
| 2025 | $769 | $13,053 | $2,736 | $10,317 |
| 2024 | $769 | $11,400 | $2,736 | $8,664 |
| 2023 | $763 | $11,400 | $2,736 | $8,664 |
| 2022 | $706 | $10,564 | $2,736 | $7,828 |
| 2021 | $707 | $10,564 | $2,736 | $7,828 |
| 2020 | $698 | $9,788 | $2,736 | $7,052 |
| 2019 | $698 | $9,788 | $2,736 | $7,052 |
| 2018 | $650 | $0 | $0 | $0 |
| 2017 | $643 | $9,063 | $2,736 | $6,327 |
| 2016 | $638 | $9,063 | $2,736 | $6,327 |
| 2015 | $589 | $9,063 | $2,736 | $6,327 |
| 2014 | -- | $9,063 | $2,736 | $6,327 |
Source: Public Records
Map
Nearby Homes
- 3516 Napoli Dr
- 3604 Weymeyer Dr
- 3501 Napoli Dr
- 3432 San Marco Dr
- 3511 Tuscany Ridge
- 3409 Napoli Dr
- 1804 N SE
- LOT 251 Kestrel Lp
- 3241 Napoli Dr
- 3307 Naples Dr
- 3239 Napoli Dr
- 3204 Ravello Dr
- 3504 Delwood Dr
- 5828 Misty Springs Way
- 5805 Harvest Leaf Dr
- 5813 Harvest Leaf Dr
- 5901 Harvest Leaf Dr
- 3520 Honey Shoal Dr
- 3703 Chestnut Dr
- 5911 Misty Springs Way
- 3613 Rutledge Dr
- 3507 Rutledge Dr
- 3606 Rutledge Dr
- 3612 Rutledge Dr
- TR O,Q, Rutledge Dr
- 5206 Brown Station Rd
- 3701 Rutledge Dr
- 5116 Brown Station Rd
- 3700 Rutledge Dr
- 3517 Greeley Dr
- 3519 Greeley Dr
- 3511 Greeley Dr
- 3601 Greeley Dr
- 5114 Brown Station Rd
- 3630 Mojave Ct Unit 104
- 3630 Mojave Ct Unit 106
- 3630 Mojave Ct
- 3630 Mojave Ct Unit 102
- 3507 Greeley Dr
- 3620 Mojave Ct Unit 104