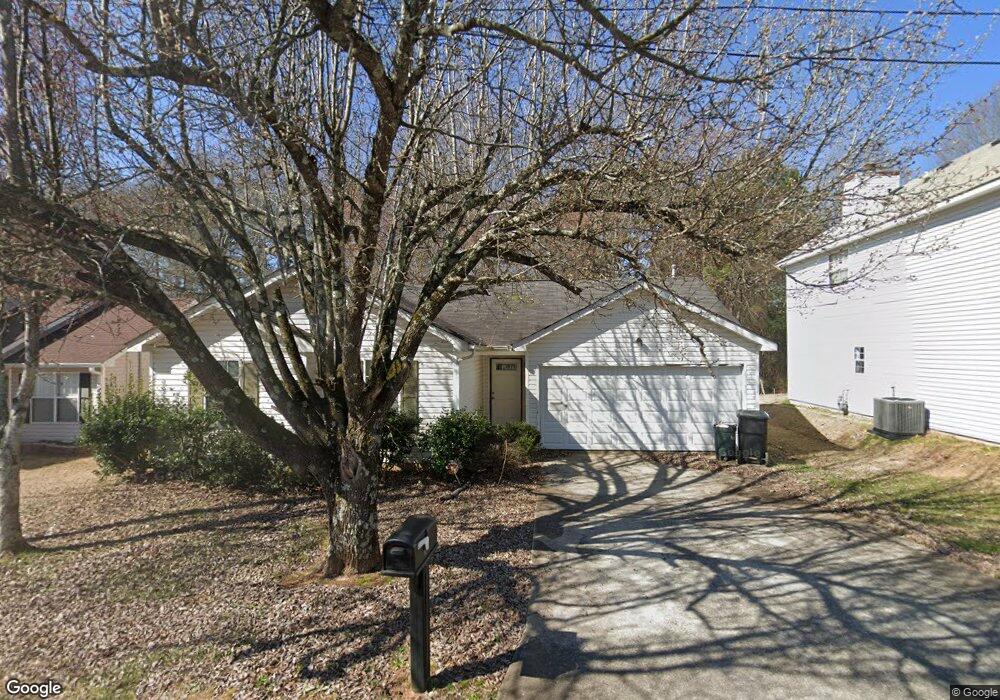
3607 Salem Glen Rd Lithonia, GA 30038
Estimated Value: $219,904 - $227,000
3
Beds
3
Baths
1,222
Sq Ft
$184/Sq Ft
Est. Value
About This Home
This home is located at 3607 Salem Glen Rd, Lithonia, GA 30038 and is currently estimated at $224,726, approximately $183 per square foot. 3607 Salem Glen Rd is a home located in DeKalb County with nearby schools including Flat Rock Elementary School, Salem Middle School, and Martin Luther King- Jr. High School.
Ownership History
Date
Name
Owned For
Owner Type
Purchase Details
Closed on
Apr 15, 2005
Sold by
Hud
Bought by
Williams Tamara P
Current Estimated Value
Home Financials for this Owner
Home Financials are based on the most recent Mortgage that was taken out on this home.
Original Mortgage
$78,400
Outstanding Balance
$40,220
Interest Rate
5.79%
Mortgage Type
New Conventional
Estimated Equity
$184,506
Purchase Details
Closed on
Jul 6, 2004
Sold by
Penco Finl Inc
Bought by
Hud
Purchase Details
Closed on
Aug 6, 2000
Sold by
Sec Of Hud
Bought by
Rogers George D
Home Financials for this Owner
Home Financials are based on the most recent Mortgage that was taken out on this home.
Original Mortgage
$101,948
Interest Rate
7.71%
Mortgage Type
FHA
Purchase Details
Closed on
Jan 29, 2000
Sold by
Sugar Sherry A
Bought by
Ne System Holdings
Purchase Details
Closed on
Apr 27, 1998
Sold by
Salem Hills Dev Co Inc
Bought by
Sugar Sherry A
Create a Home Valuation Report for This Property
The Home Valuation Report is an in-depth analysis detailing your home's value as well as a comparison with similar homes in the area
Home Values in the Area
Average Home Value in this Area
Purchase History
| Date | Buyer | Sale Price | Title Company |
|---|---|---|---|
| Williams Tamara P | -- | -- | |
| Hud | -- | -- | |
| Chase Manhattan Mtg | $112,949 | -- | |
| Rogers George D | -- | -- | |
| Ne System Holdings | -- | -- | |
| Sugar Sherry A | $84,900 | -- |
Source: Public Records
Mortgage History
| Date | Status | Borrower | Loan Amount |
|---|---|---|---|
| Open | Williams Tamara P | $78,400 | |
| Previous Owner | Rogers George D | $101,948 | |
| Closed | Sugar Sherry A | -- |
Source: Public Records
Tax History Compared to Growth
Tax History
| Year | Tax Paid | Tax Assessment Tax Assessment Total Assessment is a certain percentage of the fair market value that is determined by local assessors to be the total taxable value of land and additions on the property. | Land | Improvement |
|---|---|---|---|---|
| 2025 | $2,686 | $95,600 | $20,000 | $75,600 |
| 2024 | $2,803 | $98,640 | $20,000 | $78,640 |
| 2023 | $2,803 | $85,200 | $16,000 | $69,200 |
| 2022 | $2,366 | $84,040 | $8,800 | $75,240 |
| 2021 | $1,784 | $58,000 | $8,800 | $49,200 |
| 2020 | $1,660 | $53,160 | $7,200 | $45,960 |
| 2019 | $1,504 | $45,720 | $7,200 | $38,520 |
| 2018 | $1,074 | $32,680 | $4,440 | $28,240 |
| 2017 | $1,161 | $34,680 | $4,440 | $30,240 |
| 2016 | $1,048 | $32,160 | $4,440 | $27,720 |
| 2014 | $885 | $27,360 | $4,440 | $22,920 |
Source: Public Records
Map
Nearby Homes
- 3611 Salem Glen Rd
- 3603 Salem Glen Rd
- 3615 Salem Glen Rd
- 3608 Salem Glen Rd Unit 1
- 3604 Salem Glen Rd Unit 1
- 3612 Salem Glen Rd Unit 1
- 3595 Salem Glen Rd Unit 1A
- 3600 Salem Glen Rd
- 3621 Salem Glen Rd
- 3618 Salem Glen Rd Unit 1
- 3596 Salem Glen Rd
- 3589 Salem Glen Rd
- 3626 Salem Glen Rd
- 3626 Salem Glen Rd Unit 3626
- 3625 Salem Glen Rd
- 3590 Salem Glen Rd
- 3585 Salem Glen Rd
- 5456 Salem Springs Dr Unit 1B
- 3632 Salem Glen Rd
- 3631 Salem Glen Rd