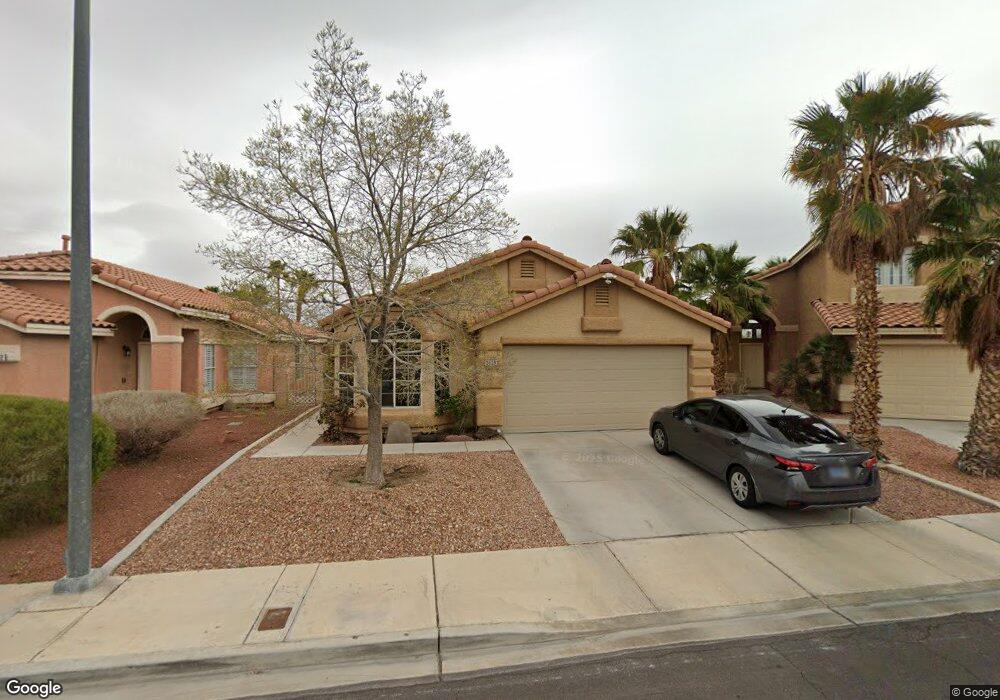
3608 Alliance St Unit 1 Las Vegas, NV 89129
Lone Mountain NeighborhoodEstimated Value: $405,000 - $422,076
3
Beds
2
Baths
1,500
Sq Ft
$275/Sq Ft
Est. Value
About This Home
This home is located at 3608 Alliance St Unit 1, Las Vegas, NV 89129 and is currently estimated at $412,019, approximately $274 per square foot. 3608 Alliance St Unit 1 is a home located in Clark County with nearby schools including Marc Kahre Elementary School, Dorothy Eisenberg Elementary School, and Irwin & Susan Molasky Junior High School.
Ownership History
Date
Name
Owned For
Owner Type
Purchase Details
Closed on
Feb 13, 2023
Sold by
Davis Rhonda
Bought by
Davis Christopher Lee
Current Estimated Value
Home Financials for this Owner
Home Financials are based on the most recent Mortgage that was taken out on this home.
Original Mortgage
$200,000
Outstanding Balance
$176,549
Interest Rate
5.73%
Mortgage Type
New Conventional
Estimated Equity
$235,470
Purchase Details
Closed on
Dec 16, 2002
Sold by
Fleck Montomery L and Fleck Denise L
Bought by
Davis Christopher Lee
Home Financials for this Owner
Home Financials are based on the most recent Mortgage that was taken out on this home.
Original Mortgage
$149,000
Interest Rate
5.83%
Mortgage Type
VA
Purchase Details
Closed on
Mar 6, 1995
Sold by
Woodside Homes Of Nevada Inc
Bought by
Fleck Montgomery L and Fleck Denise L
Home Financials for this Owner
Home Financials are based on the most recent Mortgage that was taken out on this home.
Original Mortgage
$116,473
Interest Rate
9.21%
Mortgage Type
Assumption
Create a Home Valuation Report for This Property
The Home Valuation Report is an in-depth analysis detailing your home's value as well as a comparison with similar homes in the area
Home Values in the Area
Average Home Value in this Area
Purchase History
| Date | Buyer | Sale Price | Title Company |
|---|---|---|---|
| Davis Christopher Lee | -- | Lawyers Title | |
| Davis Christopher Lee | $149,000 | Old Republic Title Company | |
| Fleck Montgomery L | $115,000 | Nevada Title Company |
Source: Public Records
Mortgage History
| Date | Status | Borrower | Loan Amount |
|---|---|---|---|
| Open | Davis Christopher Lee | $200,000 | |
| Previous Owner | Davis Christopher Lee | $149,000 | |
| Previous Owner | Fleck Montgomery L | $116,473 |
Source: Public Records
Tax History Compared to Growth
Tax History
| Year | Tax Paid | Tax Assessment Tax Assessment Total Assessment is a certain percentage of the fair market value that is determined by local assessors to be the total taxable value of land and additions on the property. | Land | Improvement |
|---|---|---|---|---|
| 2025 | $1,785 | $89,290 | $31,500 | $57,790 |
| 2024 | $1,733 | $89,290 | $31,500 | $57,790 |
| 2023 | $1,733 | $84,106 | $29,400 | $54,706 |
| 2022 | $1,683 | $74,057 | $23,800 | $50,257 |
| 2021 | $1,634 | $71,035 | $23,100 | $47,935 |
| 2020 | $1,583 | $70,145 | $22,400 | $47,745 |
| 2019 | $1,537 | $67,518 | $20,300 | $47,218 |
| 2018 | $1,493 | $60,183 | $14,700 | $45,483 |
| 2017 | $1,972 | $60,169 | $14,000 | $46,169 |
| 2016 | $1,414 | $55,527 | $9,100 | $46,427 |
| 2015 | $1,411 | $47,944 | $8,400 | $39,544 |
| 2014 | $1,369 | $40,530 | $7,000 | $33,530 |
Source: Public Records
Map
Nearby Homes
- 3695 Funston Way
- 3685 Julius Ct
- 3632 Julia Waldene Ct
- 3645 Julia Waldene Ct
- 3600 N Tomsik St
- 3758 Norton Dr
- 8212 Cactus Root Ct
- 8233 Rocky Bluff Way
- 8036 Hurricane Cove Ct
- 7908 Constantinople Ave
- 7900 Constantinople Ave
- 3473 Conough Ln Unit 5
- 3508 Tuscany Village Dr
- 7920 Aviano Pines Ave Unit 2
- 8404 Cavaricci Ave
- 3708 Bronco Billy Ct Unit 4
- 3546 Reserve Ct
- 8409 Blazing Sun Ave
- 8200 Amersham Ave
- 3640 Chateau Meadow St
- 3612 Alliance St
- 3604 Alliance St
- 3604 Alliance St
- 3616 Alliance St Unit 1
- 3602 Alliance St
- 3620 Alliance St
- 3600 Alliance St
- 3624 Alliance St
- 7998 Gorgas Ct
- 3609 Alliance St
- 3628 Alliance St
- 3663 Funston Way
- 3621 Alliance St
- 7988 Gorgas Ct
- 3632 Alliance St
- 3629 Alliance St
- 3671 Funston Way
- 7997 Gorgas Ct
- 3636 Alliance St Unit 1
- 7980 Gorgas Ct