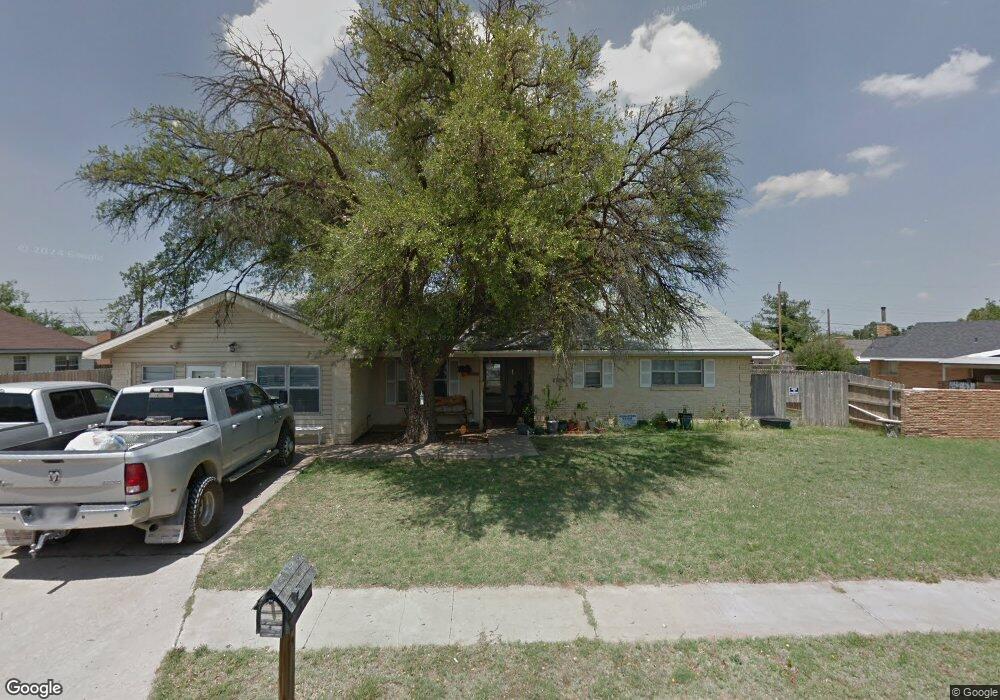
3608 Andrews Hwy Midland, TX 79703
Wedgewood Park NeighborhoodEstimated Value: $286,617 - $343,000
--
Bed
--
Bath
2,238
Sq Ft
$144/Sq Ft
Est. Value
About This Home
This home is located at 3608 Andrews Hwy, Midland, TX 79703 and is currently estimated at $321,154, approximately $143 per square foot. 3608 Andrews Hwy is a home located in Midland County with nearby schools including Rusk Elementary School, Alamo Junior High School, and Midland Montessori School.
Ownership History
Date
Name
Owned For
Owner Type
Purchase Details
Closed on
Nov 16, 2016
Sold by
Alcantar Cirilo
Bought by
Alcantar Ovel and Padron Dalila
Current Estimated Value
Purchase Details
Closed on
Jul 20, 2009
Sold by
Leonard Mary and Leonard Daniel
Bought by
Alcantar Cirilo
Home Financials for this Owner
Home Financials are based on the most recent Mortgage that was taken out on this home.
Original Mortgage
$127,546
Outstanding Balance
$84,583
Interest Rate
5.71%
Mortgage Type
FHA
Estimated Equity
$236,571
Purchase Details
Closed on
Nov 24, 2003
Sold by
Leonard Mary
Bought by
Alcantar Ovel
Purchase Details
Closed on
Dec 18, 2001
Sold by
Kitten Jerry
Bought by
Alcantar Ovel
Purchase Details
Closed on
Nov 14, 1997
Bought by
Alcantar Ovel
Purchase Details
Closed on
Jul 18, 1995
Bought by
Alcantar Ovel
Purchase Details
Closed on
Apr 2, 1974
Bought by
Alcantar Ovel
Create a Home Valuation Report for This Property
The Home Valuation Report is an in-depth analysis detailing your home's value as well as a comparison with similar homes in the area
Home Values in the Area
Average Home Value in this Area
Purchase History
| Date | Buyer | Sale Price | Title Company |
|---|---|---|---|
| Alcantar Ovel | -- | Stc | |
| Alcantar Cirilo | -- | Lone Star Abstract & Title C | |
| Alcantar Ovel | -- | -- | |
| Alcantar Ovel | -- | -- | |
| Alcantar Ovel | -- | -- | |
| Alcantar Ovel | -- | -- | |
| Alcantar Ovel | -- | -- |
Source: Public Records
Mortgage History
| Date | Status | Borrower | Loan Amount |
|---|---|---|---|
| Open | Alcantar Cirilo | $127,546 |
Source: Public Records
Tax History Compared to Growth
Tax History
| Year | Tax Paid | Tax Assessment Tax Assessment Total Assessment is a certain percentage of the fair market value that is determined by local assessors to be the total taxable value of land and additions on the property. | Land | Improvement |
|---|---|---|---|---|
| 2025 | $2,172 | $286,770 | $23,400 | $263,370 |
| 2024 | $2,176 | $213,960 | $23,400 | $190,560 |
| 2023 | $2,134 | $213,960 | $23,400 | $190,560 |
| 2022 | $3,369 | $215,660 | $23,400 | $192,260 |
| 2021 | $3,757 | $215,660 | $23,400 | $192,260 |
| 2020 | $2,991 | $203,020 | $23,400 | $179,620 |
| 2019 | $3,844 | $203,020 | $23,400 | $179,620 |
| 2018 | $3,589 | $184,570 | $23,400 | $161,170 |
| 2017 | $3,420 | $175,890 | $23,400 | $152,490 |
| 2016 | $3,334 | $171,170 | $23,400 | $147,770 |
| 2015 | -- | $171,170 | $23,400 | $147,770 |
| 2014 | -- | $165,860 | $23,400 | $142,460 |
Source: Public Records
Map
Nearby Homes
- 3523 Lonoke Ave
- 1509 Cascade Ct
- 1502 Alcove Ct
- 2000 Freeport Ln
- 3517 Seaboard Ave
- 1818 Northern Ln
- 1824 Northern Ln
- 1103 Tarleton St
- 2106 Rosita Dr
- 0000 N Midland Dr
- 3214 Lockheed Dr
- 4313 W Dengar Ave
- 3204 Shell Ave
- 3213 Shell Ave
- 2121 Bonham St
- 3213 Sentinel Dr
- 3209 Sinclair Ave
- 3311 Terrace Ave
- 3802 Suncrest Ave
- 3204 W Golf Course Rd