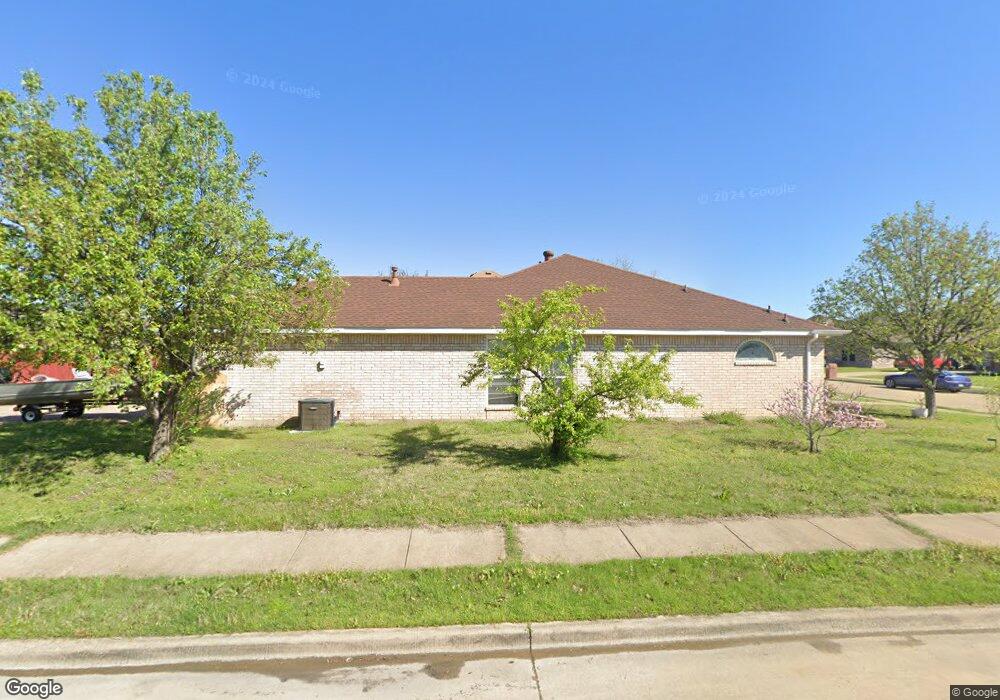
3608 Ty Cir Sachse, TX 75048
Estimated Value: $326,000 - $358,000
3
Beds
2
Baths
1,507
Sq Ft
$227/Sq Ft
Est. Value
About This Home
This home is located at 3608 Ty Cir, Sachse, TX 75048 and is currently estimated at $341,680, approximately $226 per square foot. 3608 Ty Cir is a home located in Collin County with nearby schools including Don Whitt Elementary School, Dr. Al Draper Intermediate Middle School, and Raymond B Cooper J High School.
Ownership History
Date
Name
Owned For
Owner Type
Purchase Details
Closed on
Jan 16, 2013
Sold by
Luong Phuong T
Bought by
Luong Phuong T and Le Bao Chau Thi
Current Estimated Value
Purchase Details
Closed on
Sep 29, 2005
Sold by
Woolridge Ken W and Woolridge Fang
Bought by
Luong Phuong T
Home Financials for this Owner
Home Financials are based on the most recent Mortgage that was taken out on this home.
Original Mortgage
$101,600
Outstanding Balance
$54,381
Interest Rate
5.76%
Estimated Equity
$287,299
Purchase Details
Closed on
Nov 11, 1997
Sold by
Choice Homes Texas Inc
Bought by
Woolridge Ken W and Woolridge Fang
Home Financials for this Owner
Home Financials are based on the most recent Mortgage that was taken out on this home.
Original Mortgage
$98,517
Interest Rate
7.23%
Purchase Details
Closed on
Aug 5, 1997
Sold by
Davis/Sachse Lp
Bought by
Choice Homes Texas Inc
Create a Home Valuation Report for This Property
The Home Valuation Report is an in-depth analysis detailing your home's value as well as a comparison with similar homes in the area
Home Values in the Area
Average Home Value in this Area
Purchase History
| Date | Buyer | Sale Price | Title Company |
|---|---|---|---|
| Luong Phuong T | -- | Reunion | |
| Luong Phuong T | -- | Rtt | |
| Woolridge Ken W | -- | -- | |
| Choice Homes Texas Inc | -- | -- |
Source: Public Records
Mortgage History
| Date | Status | Borrower | Loan Amount |
|---|---|---|---|
| Open | Luong Phuong T | $101,600 | |
| Previous Owner | Woolridge Ken W | $98,517 |
Source: Public Records
Tax History Compared to Growth
Tax History
| Year | Tax Paid | Tax Assessment Tax Assessment Total Assessment is a certain percentage of the fair market value that is determined by local assessors to be the total taxable value of land and additions on the property. | Land | Improvement |
|---|---|---|---|---|
| 2025 | $7,132 | $323,615 | $100,000 | $223,615 |
| 2024 | $7,132 | $304,215 | $100,000 | $241,031 |
| 2023 | $7,132 | $276,559 | $80,000 | $246,979 |
| 2022 | $5,737 | $251,417 | $80,000 | $209,575 |
| 2021 | $5,508 | $247,135 | $55,000 | $192,135 |
| 2020 | $5,225 | $207,783 | $55,000 | $152,783 |
| 2019 | $5,084 | $193,916 | $55,000 | $153,132 |
| 2018 | $4,688 | $176,287 | $55,000 | $142,540 |
| 2017 | $4,262 | $190,114 | $45,000 | $145,114 |
| 2016 | $3,915 | $153,738 | $30,000 | $123,738 |
| 2015 | $3,024 | $138,773 | $30,000 | $108,773 |
Source: Public Records
Map
Nearby Homes
- 3206 Creekside Dr
- 3604 Texas Dr
- 6925 Dewitt Rd
- 7309 Parkwood Dr
- 3117 Tina St
- 7213 Bronco Bluff
- 2415 Green Meadow Dr
- 6315 Sachse St
- 3521 Meadowside Dr
- 7114 Running Iron Trail
- 2605 Mcdearmon St
- 7706 Paddock Trail
- 3818 Missouri St
- 4125 Caprock Canyon Rd
- 6218 Dewitt St
- 5937 Boone St
- 4007 William St
- 3320 Bryan St
- 7612 Cindy Ln
- 2911 Tracy Lynn Ln