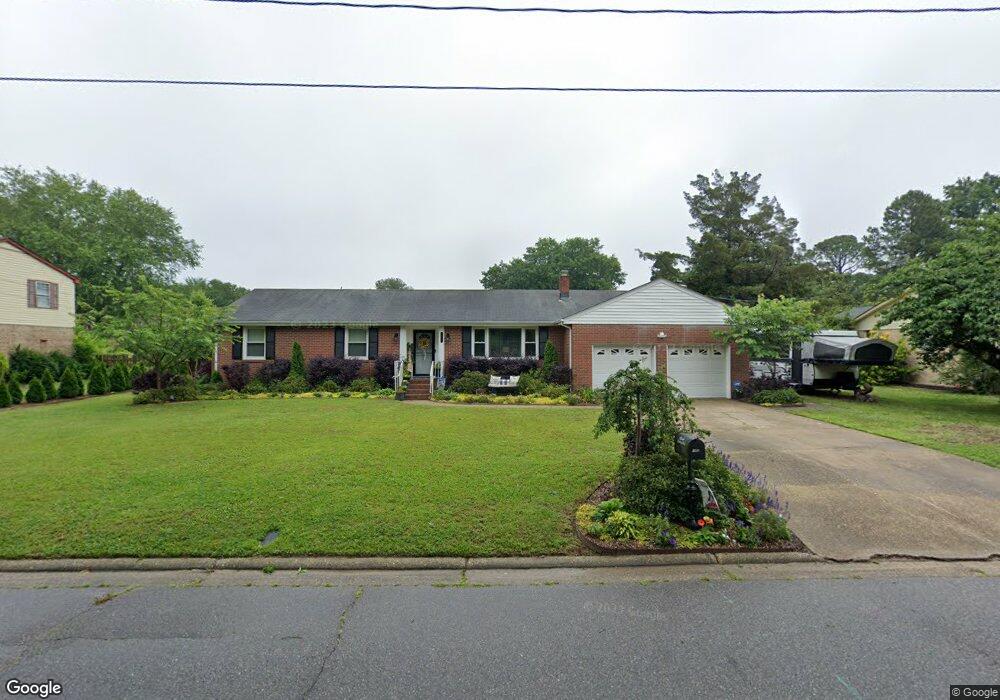
3609 Hermitage Dr Portsmouth, VA 23703
Churchland NeighborhoodEstimated Value: $357,000 - $383,000
3
Beds
2
Baths
1,650
Sq Ft
$222/Sq Ft
Est. Value
About This Home
This home is located at 3609 Hermitage Dr, Portsmouth, VA 23703 and is currently estimated at $366,513, approximately $222 per square foot. 3609 Hermitage Dr is a home located in Portsmouth City with nearby schools including Churchland Elementary School, Churchland Academy Elementary School, and Churchland Middle School.
Ownership History
Date
Name
Owned For
Owner Type
Purchase Details
Closed on
Jun 21, 2024
Sold by
Tuminaro Heather Anne and Mcelroy Heather Anne
Bought by
Clement Danielle and Whitney David Matthew
Current Estimated Value
Home Financials for this Owner
Home Financials are based on the most recent Mortgage that was taken out on this home.
Original Mortgage
$339,500
Outstanding Balance
$334,927
Interest Rate
7.09%
Mortgage Type
VA
Estimated Equity
$31,586
Purchase Details
Closed on
Dec 28, 2018
Sold by
Walden Andrew L and Walden Jennifer C
Bought by
Tuminaro Heather A
Home Financials for this Owner
Home Financials are based on the most recent Mortgage that was taken out on this home.
Original Mortgage
$218,025
Interest Rate
4.8%
Mortgage Type
New Conventional
Purchase Details
Closed on
Jun 30, 2015
Sold by
Jones Gloria A
Bought by
Walden Andrew L
Home Financials for this Owner
Home Financials are based on the most recent Mortgage that was taken out on this home.
Original Mortgage
$228,713
Interest Rate
3.83%
Mortgage Type
VA
Create a Home Valuation Report for This Property
The Home Valuation Report is an in-depth analysis detailing your home's value as well as a comparison with similar homes in the area
Home Values in the Area
Average Home Value in this Area
Purchase History
| Date | Buyer | Sale Price | Title Company |
|---|---|---|---|
| Clement Danielle | $344,500 | Champion Title | |
| Tuminaro Heather A | $229,500 | Barristers Of Virginia | |
| Walden Andrew L | $223,900 | -- |
Source: Public Records
Mortgage History
| Date | Status | Borrower | Loan Amount |
|---|---|---|---|
| Open | Clement Danielle | $339,500 | |
| Previous Owner | Tuminaro Heather A | $218,025 | |
| Previous Owner | Walden Andrew L | $228,713 |
Source: Public Records
Tax History Compared to Growth
Tax History
| Year | Tax Paid | Tax Assessment Tax Assessment Total Assessment is a certain percentage of the fair market value that is determined by local assessors to be the total taxable value of land and additions on the property. | Land | Improvement |
|---|---|---|---|---|
| 2025 | $3,051 | $317,970 | $97,580 | $220,390 |
| 2024 | $3,051 | $314,700 | $97,580 | $217,120 |
| 2023 | $3,962 | $303,290 | $97,580 | $205,710 |
| 2022 | $3,498 | $269,080 | $81,320 | $187,760 |
| 2021 | $3,084 | $237,260 | $62,550 | $174,710 |
| 2020 | $3,003 | $231,030 | $59,580 | $171,450 |
| 2019 | $2,897 | $222,880 | $59,580 | $163,300 |
| 2018 | $2,754 | $211,820 | $59,580 | $152,240 |
| 2017 | $2,754 | $211,820 | $59,580 | $152,240 |
| 2016 | $2,733 | $210,260 | $59,580 | $150,680 |
| 2015 | $2,733 | $210,260 | $59,580 | $150,680 |
| 2014 | $2,668 | $210,080 | $59,580 | $150,500 |
Source: Public Records
Map
Nearby Homes
- 4412 Carlton Ct
- 4705 Templar Dr
- 3408 Wakefield Dr
- 2004 Sawgrass Ln
- 3613 Cardinal Ln
- 4239 Hatton Point Ln Unit 35
- 4808 Thornwood St
- 3609 Loon Ct
- 4313 Templar Dr
- 3405 Canterbury Dr
- 4257 Hatton Point Ln Unit 44
- 3609 Linnet Ln
- 4286 Hatton Point Ln
- 4285 Hatton Point Ln
- 4291 Hatton Point Ln
- 3141 Riveredge Dr
- 3108 Whaley Rd
- 6 Waterview Ct
- 3728 Cardinal Ln
- 3425 Cedar Ln
- 3605 Hermitage Dr
- 3613 Hermitage Dr
- 3717 Shoreline Dr
- 3721 Shoreline Dr
- 3612 Hermitage Dr
- 3713 Shoreline Dr
- 3608 Hermitage Dr
- 3601 Hermitage Dr
- 3617 Hermitage Dr
- 3616 Hermitage Dr
- 3604 Hermitage Dr
- 3725 Shoreline Dr
- 3709 Shoreline Dr
- 4504 Glencove Dr
- 3736 Shoreline Dr
- 3625 Shoreline Dr
- 3613 Shoreline Dr
- 3617 Shoreline Dr
- 3740 Shoreline Dr
- 3701 Shoreline Dr