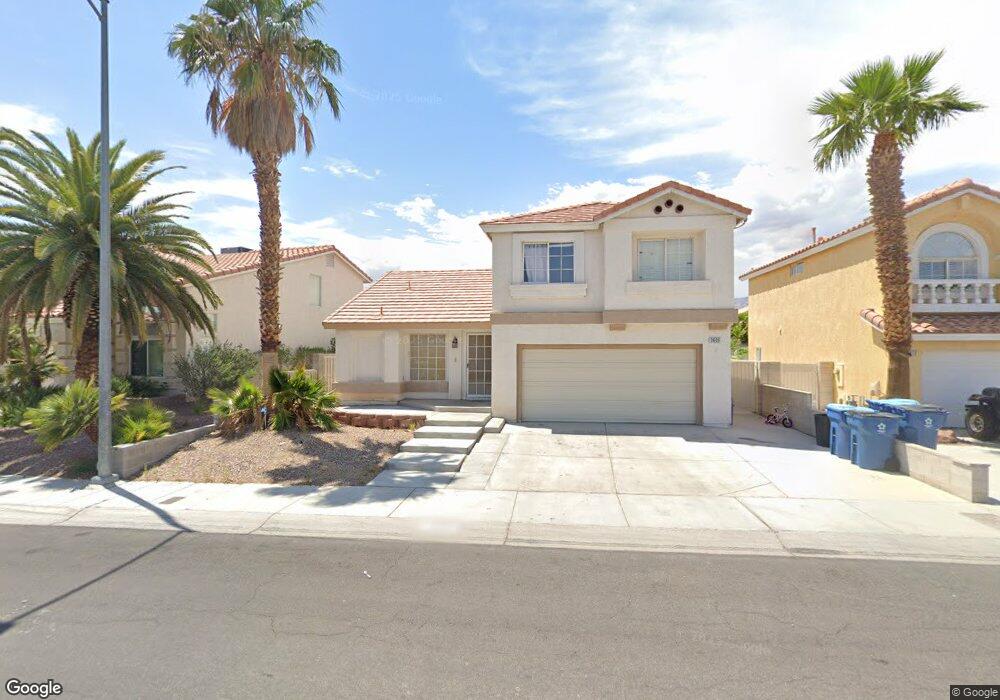
3609 Misty Falls St Las Vegas, NV 89129
Lone Mountain NeighborhoodEstimated Value: $404,941 - $433,000
3
Beds
3
Baths
1,524
Sq Ft
$274/Sq Ft
Est. Value
About This Home
This home is located at 3609 Misty Falls St, Las Vegas, NV 89129 and is currently estimated at $418,235, approximately $274 per square foot. 3609 Misty Falls St is a home located in Clark County with nearby schools including Edith Garehime Elementary School, Irwin & Susan Molasky Junior High School, and Centennial High School.
Ownership History
Date
Name
Owned For
Owner Type
Purchase Details
Closed on
Aug 28, 2019
Sold by
Gikas Alexandros and Gikas Alex
Bought by
Atkins Peters Janette Shontell
Current Estimated Value
Home Financials for this Owner
Home Financials are based on the most recent Mortgage that was taken out on this home.
Original Mortgage
$275,910
Outstanding Balance
$251,678
Interest Rate
5.87%
Mortgage Type
FHA
Estimated Equity
$166,557
Purchase Details
Closed on
Jul 6, 2016
Sold by
Nelson Richard M
Bought by
Gkikas Alex
Home Financials for this Owner
Home Financials are based on the most recent Mortgage that was taken out on this home.
Original Mortgage
$206,196
Interest Rate
3.99%
Mortgage Type
FHA
Purchase Details
Closed on
Jun 29, 2015
Sold by
Rodriguez Rodolfo J and Rodriguez Silvia O
Bought by
Nelson Richard M and Nelson Griselda
Home Financials for this Owner
Home Financials are based on the most recent Mortgage that was taken out on this home.
Original Mortgage
$138,380
Interest Rate
3.87%
Mortgage Type
FHA
Purchase Details
Closed on
Aug 23, 2010
Sold by
Pagulayan Orlando Felix and Pagulayan Elizabeth
Bought by
Rodriguez Rodolfo J and Rodriguez Silvia O
Home Financials for this Owner
Home Financials are based on the most recent Mortgage that was taken out on this home.
Original Mortgage
$97,465
Interest Rate
4.25%
Mortgage Type
FHA
Purchase Details
Closed on
Feb 27, 2006
Sold by
Kronk Michael
Bought by
Pagulayan Orlando Felix and Pagulayan Elizabeth
Home Financials for this Owner
Home Financials are based on the most recent Mortgage that was taken out on this home.
Original Mortgage
$230,000
Interest Rate
7.1%
Mortgage Type
New Conventional
Purchase Details
Closed on
Feb 5, 2001
Sold by
Va
Bought by
Kronk Michael
Home Financials for this Owner
Home Financials are based on the most recent Mortgage that was taken out on this home.
Original Mortgage
$142,270
Interest Rate
7.12%
Mortgage Type
Seller Take Back
Purchase Details
Closed on
Nov 6, 2000
Sold by
Old Kent Mtg Company
Bought by
Va
Purchase Details
Closed on
Oct 31, 2000
Sold by
Moya Michael J and Moya Kim
Bought by
Old Kent Mtg Company
Purchase Details
Closed on
Aug 10, 1998
Sold by
American West Homes Inc
Bought by
Moya Michael J and Moya Kim
Home Financials for this Owner
Home Financials are based on the most recent Mortgage that was taken out on this home.
Original Mortgage
$136,166
Interest Rate
6.95%
Mortgage Type
VA
Create a Home Valuation Report for This Property
The Home Valuation Report is an in-depth analysis detailing your home's value as well as a comparison with similar homes in the area
Home Values in the Area
Average Home Value in this Area
Purchase History
| Date | Buyer | Sale Price | Title Company |
|---|---|---|---|
| Atkins Peters Janette Shontell | $281,000 | Stewart Title Company F | |
| Gkikas Alex | $210,000 | Netco | |
| Nelson Richard M | $160,000 | First American Title Ins | |
| Rodriguez Rodolfo J | $100,000 | First American Title Paseo | |
| Pagulayan Orlando Felix | $287,500 | Ticor Title Of Nevada Inc | |
| Kronk Michael | -- | -- | |
| Va | -- | Fidelity National Title | |
| Old Kent Mtg Company | $119,417 | United Title | |
| Moya Michael J | $133,000 | First American Title Co |
Source: Public Records
Mortgage History
| Date | Status | Borrower | Loan Amount |
|---|---|---|---|
| Open | Atkins Peters Janette Shontell | $275,910 | |
| Previous Owner | Gkikas Alex | $206,196 | |
| Previous Owner | Nelson Richard M | $138,380 | |
| Previous Owner | Rodriguez Rodolfo J | $97,465 | |
| Previous Owner | Pagulayan Orlando Felix | $230,000 | |
| Previous Owner | Kronk Michael | $142,270 | |
| Previous Owner | Moya Michael J | $136,166 |
Source: Public Records
Tax History Compared to Growth
Tax History
| Year | Tax Paid | Tax Assessment Tax Assessment Total Assessment is a certain percentage of the fair market value that is determined by local assessors to be the total taxable value of land and additions on the property. | Land | Improvement |
|---|---|---|---|---|
| 2025 | $2,054 | $90,247 | $34,300 | $55,947 |
| 2024 | $1,903 | $90,247 | $34,300 | $55,947 |
| 2023 | $1,903 | $84,482 | $31,500 | $52,982 |
| 2022 | $1,762 | $74,046 | $25,550 | $48,496 |
| 2021 | $1,632 | $70,348 | $24,150 | $46,198 |
| 2020 | $1,512 | $69,695 | $23,800 | $45,895 |
| 2019 | $1,417 | $64,757 | $19,600 | $45,157 |
| 2018 | $1,352 | $60,129 | $16,800 | $43,329 |
| 2017 | $1,933 | $58,970 | $15,050 | $43,920 |
| 2016 | $1,267 | $52,257 | $10,500 | $41,757 |
| 2015 | $1,263 | $44,752 | $8,750 | $36,002 |
| 2014 | -- | $36,944 | $7,000 | $29,944 |
Source: Public Records
Map
Nearby Homes
- 8769 Country View Ave
- 8756 Harvest Valley Ave
- 8776 Country View Ave
- 8757 Autumn Valley Ave
- 8733 Country Pines Ave
- 8780 Autumn Valley Ave
- 3692 River Canyon Rd
- 3702 River Canyon Rd
- 8737 Autumn Valley Ave
- 8828 Juniper Knoll Ave
- 8717 Blazing Saddle Ave
- 8860 Hampton Green Ave
- 8729 W Gilmore Ave
- 8820 Cornwall Glen Ave
- 3805 White Castle St
- 3571 N Campbell Rd
- 8829 Cornwall Glen Ave
- 8715 Harwich Ave
- 8620 Copper Mountain Ave
- 8963 Green Jade Dr
- 3613 Misty Falls St
- 3605 Misty Falls St
- 3617 Misty Falls St
- 3601 Misty Falls St
- 8764 Raindrop Canyon Ave
- 8764 Raindrop Canyon Ave Unit n/a
- 8777 Harvest Valley Ave
- 3621 Misty Falls St
- 3626 Ferndale Cove Dr
- 8769 Raindrop Canyon Ave
- 3636 Ferndale Cove Dr
- 8760 Raindrop Canyon Ave
- 8773 Harvest Valley Ave
- 3616 Ferndale Cove Dr
- 8765 Raindrop Canyon Ave
- 3625 Misty Falls St
- 3646 Ferndale Cove Dr
- 8776 Harvest Valley Ave
- 8761 Raindrop Canyon Ave
- 8756 Raindrop Canyon Ave