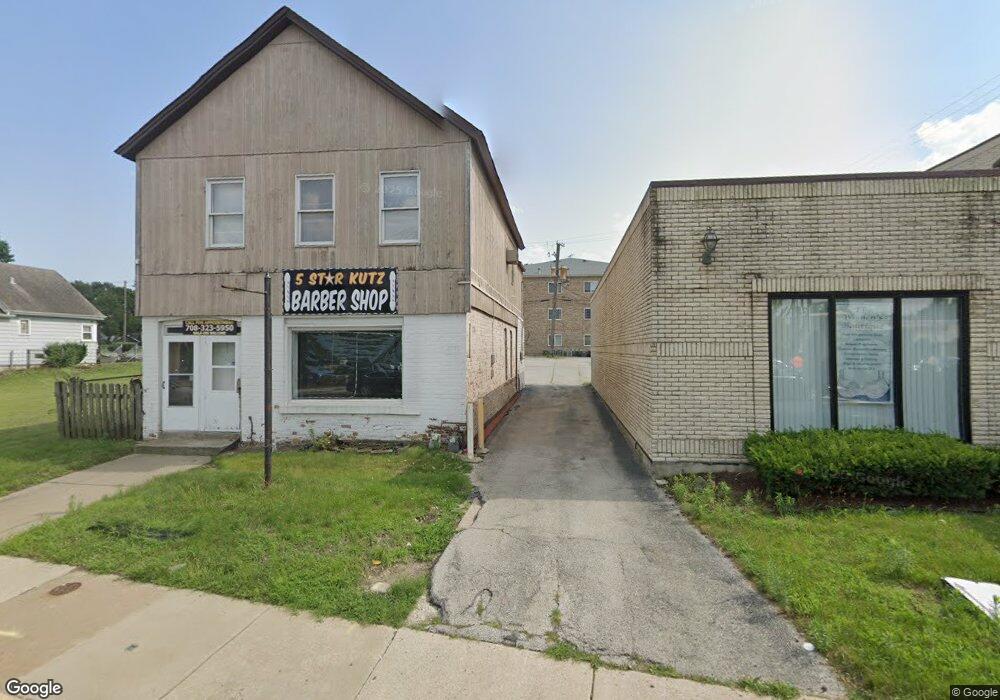
3609 Ridge Rd Unit 2 Lansing, IL 60438
Estimated Value: $176,000 - $189,000
1
Bed
1
Bath
1,530
Sq Ft
$119/Sq Ft
Est. Value
About This Home
This home is located at 3609 Ridge Rd Unit 2, Lansing, IL 60438 and is currently estimated at $182,500, approximately $119 per square foot. 3609 Ridge Rd Unit 2 is a home located in Cook County with nearby schools including Coolidge Elementary School, Memorial Jr High School, and Thornton Fractnl So High School.
Ownership History
Date
Name
Owned For
Owner Type
Purchase Details
Closed on
Jun 4, 2024
Sold by
North Shore Holdings Ltd
Bought by
Supreme Studios 2 Inc
Current Estimated Value
Home Financials for this Owner
Home Financials are based on the most recent Mortgage that was taken out on this home.
Original Mortgage
$140,000
Outstanding Balance
$138,281
Interest Rate
7.22%
Mortgage Type
Credit Line Revolving
Estimated Equity
$44,219
Purchase Details
Closed on
Nov 8, 2005
Sold by
First National Bank Of Illinois
Bought by
North Shore Holdings Ltd
Home Financials for this Owner
Home Financials are based on the most recent Mortgage that was taken out on this home.
Original Mortgage
$382,500
Interest Rate
6.75%
Mortgage Type
Commercial
Create a Home Valuation Report for This Property
The Home Valuation Report is an in-depth analysis detailing your home's value as well as a comparison with similar homes in the area
Home Values in the Area
Average Home Value in this Area
Purchase History
| Date | Buyer | Sale Price | Title Company |
|---|---|---|---|
| Supreme Studios 2 Inc | $165,000 | Saturn Title | |
| North Shore Holdings Ltd | $510,000 | Pntn |
Source: Public Records
Mortgage History
| Date | Status | Borrower | Loan Amount |
|---|---|---|---|
| Open | Supreme Studios 2 Inc | $140,000 | |
| Previous Owner | North Shore Holdings Ltd | $382,500 |
Source: Public Records
Tax History Compared to Growth
Tax History
| Year | Tax Paid | Tax Assessment Tax Assessment Total Assessment is a certain percentage of the fair market value that is determined by local assessors to be the total taxable value of land and additions on the property. | Land | Improvement |
|---|---|---|---|---|
| 2024 | $4,838 | $10,000 | $2,493 | $7,507 |
| 2023 | $5,572 | $10,000 | $2,493 | $7,507 |
| 2022 | $5,572 | $8,575 | $2,153 | $6,422 |
| 2021 | $5,420 | $8,574 | $2,152 | $6,422 |
| 2020 | $5,030 | $8,574 | $2,152 | $6,422 |
| 2019 | $4,026 | $7,071 | $1,812 | $5,259 |
| 2018 | $3,951 | $7,071 | $1,812 | $5,259 |
| 2017 | $3,990 | $7,071 | $1,812 | $5,259 |
| 2016 | $3,554 | $6,500 | $1,699 | $4,801 |
| 2015 | $3,302 | $6,500 | $1,699 | $4,801 |
| 2014 | $3,257 | $6,500 | $1,699 | $4,801 |
| 2013 | $3,474 | $7,716 | $1,699 | $6,017 |
Source: Public Records
Map
Nearby Homes
- 18215 Wentworth Ave Unit 3B
- 3627 Ridge Rd
- 18333 Wentworth Ave Unit 7
- 18405 Wentworth Ave Unit 1D
- 18358 Willow Ln
- 18316 Sherman St
- 18416 Willow Ln
- 18275 Ada St
- 18504 Wentworth Ave
- 18443 Maple St
- 17945 Maple St
- 3640 186th St Unit 101
- 3620 186th St Unit 405
- 18302 Roy St
- 8130 Meadow Ln
- 17922 State Line Ave
- 8019 Hohman Ave
- 7937 Forest Ave
- 3423 Adams St
- 108 Beverly Place
- 3609 Ridge Rd
- 3256 Ridge Rd
- 3256 Ridge Rd
- 3256 Ridge Rd
- 3256 Ridge Rd Unit 2A
- 3601 Ridge Rd Unit 2R
- 3601 Ridge Rd Unit 2F
- 3615 Ridge Rd
- 3615 Ridge Rd Unit LOWR
- 18215 Wentworth Ave Unit 2B
- 18215 Wentworth Ave Unit 1D
- 18215 Wentworth Ave Unit 1E
- 18215 Wentworth Ave Unit 2E
- 18215 Wentworth Ave Unit 1A
- 18215 Wentworth Ave Unit 3E
- 18215 Wentworth Ave Unit 3A
- 18215 Wentworth Ave Unit 1C
- 18215 Wentworth Ave Unit 2C
- 18215 Wentworth Ave Unit 3D
- 18215 Wentworth Ave Unit 2D