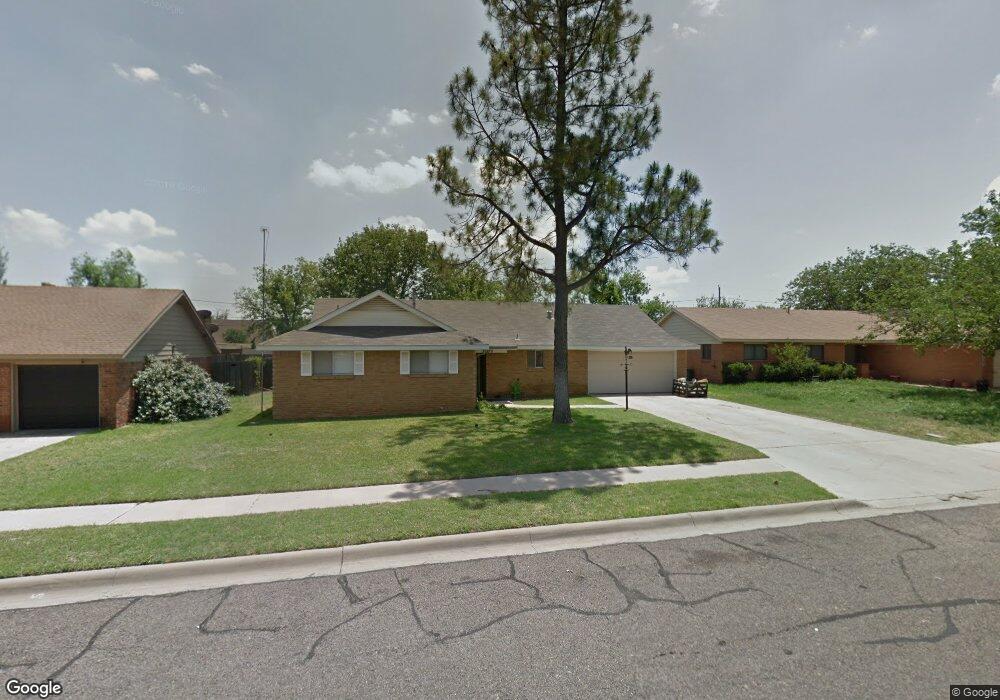
3609 Sinclair Ave Midland, TX 79707
Wedgewood Park NeighborhoodEstimated Value: $248,839 - $312,000
--
Bed
--
Bath
1,639
Sq Ft
$166/Sq Ft
Est. Value
About This Home
This home is located at 3609 Sinclair Ave, Midland, TX 79707 and is currently estimated at $271,460, approximately $165 per square foot. 3609 Sinclair Ave is a home located in Midland County with nearby schools including Rusk Elementary School, Alamo Junior High School, and Midland Montessori School.
Ownership History
Date
Name
Owned For
Owner Type
Purchase Details
Closed on
Feb 27, 2020
Sold by
Morgan Mirenda D and Morgan Terry D
Bought by
Li Vuczu
Current Estimated Value
Home Financials for this Owner
Home Financials are based on the most recent Mortgage that was taken out on this home.
Original Mortgage
$254,308
Outstanding Balance
$224,691
Interest Rate
3.6%
Mortgage Type
FHA
Estimated Equity
$46,769
Purchase Details
Closed on
Jan 27, 2017
Sold by
Stanford Mary Clare
Bought by
Morgan Mirenda D and Morgan Terry D
Home Financials for this Owner
Home Financials are based on the most recent Mortgage that was taken out on this home.
Original Mortgage
$151,354
Interest Rate
4.16%
Mortgage Type
New Conventional
Purchase Details
Closed on
Jun 19, 1973
Bought by
Morgan Terry D
Create a Home Valuation Report for This Property
The Home Valuation Report is an in-depth analysis detailing your home's value as well as a comparison with similar homes in the area
Home Values in the Area
Average Home Value in this Area
Purchase History
| Date | Buyer | Sale Price | Title Company |
|---|---|---|---|
| Li Vuczu | -- | West Texas Abstract | |
| Morgan Mirenda D | -- | West Tx Abstract & Title Co | |
| Morgan Terry D | -- | -- |
Source: Public Records
Mortgage History
| Date | Status | Borrower | Loan Amount |
|---|---|---|---|
| Open | Li Vuczu | $254,308 | |
| Previous Owner | Morgan Mirenda D | $151,354 |
Source: Public Records
Tax History Compared to Growth
Tax History
| Year | Tax Paid | Tax Assessment Tax Assessment Total Assessment is a certain percentage of the fair market value that is determined by local assessors to be the total taxable value of land and additions on the property. | Land | Improvement |
|---|---|---|---|---|
| 2025 | $2,711 | $190,000 | $21,600 | $168,400 |
| 2024 | $2,715 | $178,770 | $21,600 | $157,170 |
| 2023 | $2,679 | $178,770 | $21,600 | $157,170 |
| 2022 | $2,835 | $181,430 | $21,600 | $159,830 |
| 2021 | $3,161 | $181,430 | $21,600 | $159,830 |
| 2020 | $2,905 | $170,250 | $21,600 | $148,650 |
| 2019 | $3,223 | $170,220 | $21,600 | $148,650 |
| 2018 | $3,009 | $154,750 | $21,600 | $133,150 |
| 2017 | $2,870 | $147,610 | $21,600 | $126,010 |
| 2016 | $2,547 | $138,780 | $21,600 | $117,180 |
| 2015 | -- | $138,780 | $21,600 | $117,180 |
| 2014 | -- | $135,140 | $21,600 | $113,540 |
Source: Public Records
Map
Nearby Homes
- 3523 Lonoke Ave
- 1509 Cascade Ct
- 1502 Alcove Ct
- 2000 Freeport Ln
- 3517 Seaboard Ave
- 1818 Northern Ln
- 1824 Northern Ln
- 1103 Tarleton St
- 2106 Rosita Dr
- 3204 Shell Ave
- 4313 W Dengar Ave
- 3214 Lockheed Dr
- 3213 Shell Ave
- 0000 N Midland Dr
- 3213 Sentinel Dr
- 3311 Terrace Ave
- 3209 Sinclair Ave
- 3802 Suncrest Ave
- 2121 Bonham St
- 3204 W Golf Course Rd
- 3611 Sinclair Ave
- 3607 Sinclair Ave
- 3606 Boyd Ave
- 3613 Sinclair Ave
- 3608 Boyd Ave
- 3605 Sinclair Ave
- 3608 Sinclair Ave
- 3604 Boyd Ave
- 3606 Sinclair Ave
- 3610 Boyd Ave
- 3610 Sinclair Ave
- 3615 Sinclair Ave
- 3603 Sinclair Ave
- 3602 Boyd Ave
- 3604 Sinclair Ave
- 3612 Sinclair Ave
- 3612 Boyd Ave
- 3617 Sinclair Ave
- 3614 Sinclair Ave
- 3602 Sinclair Ave