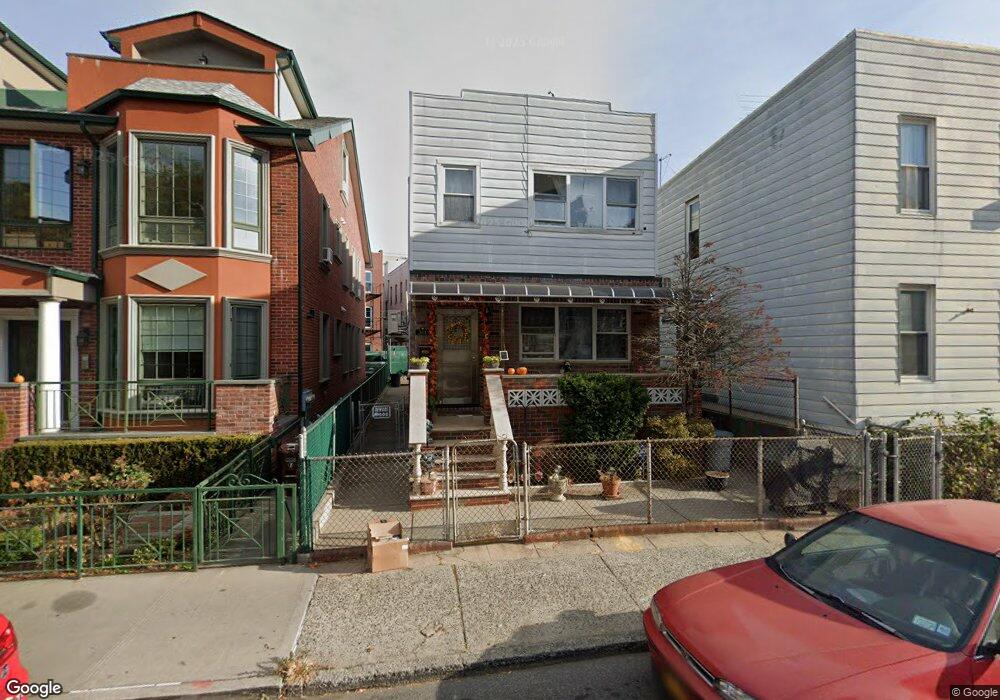
361 90th St Unit Building Brooklyn, NY 11209
Fort Hamilton NeighborhoodEstimated Value: $1,037,000 - $1,355,000
--
Bed
3
Baths
1,548
Sq Ft
$795/Sq Ft
Est. Value
About This Home
This home is located at 361 90th St Unit Building, Brooklyn, NY 11209 and is currently estimated at $1,230,027, approximately $794 per square foot. 361 90th St Unit Building is a home located in Kings County with nearby schools including P.S. 264 Bay Ridge Elementary School for the Arts, P.S./I.S. 104 The Fort Hamilton School, and Fort Hamilton High School.
Ownership History
Date
Name
Owned For
Owner Type
Purchase Details
Closed on
Aug 4, 2021
Sold by
Chan Sui Feng and Song Jing
Bought by
Ooi Eileen H and Ooi Hwai Y
Current Estimated Value
Home Financials for this Owner
Home Financials are based on the most recent Mortgage that was taken out on this home.
Original Mortgage
$817,500
Outstanding Balance
$742,241
Interest Rate
2.8%
Mortgage Type
Purchase Money Mortgage
Estimated Equity
$487,786
Purchase Details
Closed on
May 28, 2008
Sold by
Fras Construction Llc
Bought by
Chan Sui Feng and Song Jing
Purchase Details
Closed on
Apr 19, 2007
Sold by
Sansevere Marie and Sansevere Richard V
Bought by
Fras Construction Llc
Purchase Details
Closed on
Oct 5, 1999
Sold by
Sansevere Marie
Bought by
Sansevere Marie and Sansevere Richard
Create a Home Valuation Report for This Property
The Home Valuation Report is an in-depth analysis detailing your home's value as well as a comparison with similar homes in the area
Home Values in the Area
Average Home Value in this Area
Purchase History
| Date | Buyer | Sale Price | Title Company |
|---|---|---|---|
| Ooi Eileen H | $1,090,000 | -- | |
| Ooi Eileen H | $1,090,000 | -- | |
| Chan Sui Feng | $577,000 | -- | |
| Chan Sui Feng | $577,000 | -- | |
| Fras Construction Llc | $525,000 | -- | |
| Fras Construction Llc | $525,000 | -- | |
| Sansevere Marie | -- | Commonwealth Land Title Ins | |
| Sansevere Marie | -- | Commonwealth Land Title Ins |
Source: Public Records
Mortgage History
| Date | Status | Borrower | Loan Amount |
|---|---|---|---|
| Open | Ooi Eileen H | $817,500 | |
| Closed | Ooi Eileen H | $817,500 |
Source: Public Records
Tax History Compared to Growth
Tax History
| Year | Tax Paid | Tax Assessment Tax Assessment Total Assessment is a certain percentage of the fair market value that is determined by local assessors to be the total taxable value of land and additions on the property. | Land | Improvement |
|---|---|---|---|---|
| 2025 | $7,772 | $62,460 | $11,760 | $50,700 |
| 2024 | $7,772 | $60,060 | $11,760 | $48,300 |
| 2023 | $7,422 | $65,640 | $11,760 | $53,880 |
| 2022 | $6,952 | $53,700 | $11,760 | $41,940 |
| 2021 | $5,957 | $58,920 | $11,760 | $47,160 |
| 2020 | $2,959 | $69,600 | $11,760 | $57,840 |
| 2019 | $5,741 | $69,600 | $11,760 | $57,840 |
| 2018 | $4,932 | $30,456 | $4,678 | $25,778 |
| 2017 | $5,028 | $29,020 | $5,632 | $23,388 |
| 2016 | $4,622 | $27,588 | $6,862 | $20,726 |
| 2015 | $2,783 | $27,570 | $10,291 | $17,279 |
| 2014 | $2,783 | $26,872 | $12,029 | $14,843 |
Source: Public Records
Map
Nearby Homes
- 344 89th St
- 341 91st St
- 346 91st St Unit 307
- 411 88th St
- 413 88th St
- 409 92nd St
- 338 92nd St Unit 1B
- 455 87th St
- 317 W 93rd St Unit 1-C
- 349 87th St
- 8627 5th Ave
- 8710 3rd Ave
- 9040 Fort Hamilton Pkwy Unit 3
- 9040 Fort Hamilton Pkwy Unit 4G
- 9040 Fort Hamilton Pkwy Unit 2 I
- 8622 3rd Ave
- 8515 4th Ave
- 237 91st St
- 341 86th St
- 8612 3rd Ave
- 361 90th St
- 365 90th St
- 359 90th St
- 359 90th St Unit 1-A
- 359 90th St Unit 1B
- 357 90th St Unit 2-B
- 357 90th St
- 357 90th St Unit 2A
- 357 90th St Unit 1A
- 42 Forest Place
- 367 90th St
- 355 90th St
- 38 Forest Place
- 38 Forest Place Unit HOUSE
- 353 90th St
- 364 90 St Unit 2A
- 360 89th St
- 362 89th St Unit House
- 362 89th St
- 358 89th St