Estimated Value: $144,000 - $196,000
Studio
1
Bath
572
Sq Ft
$298/Sq Ft
Est. Value
About This Home
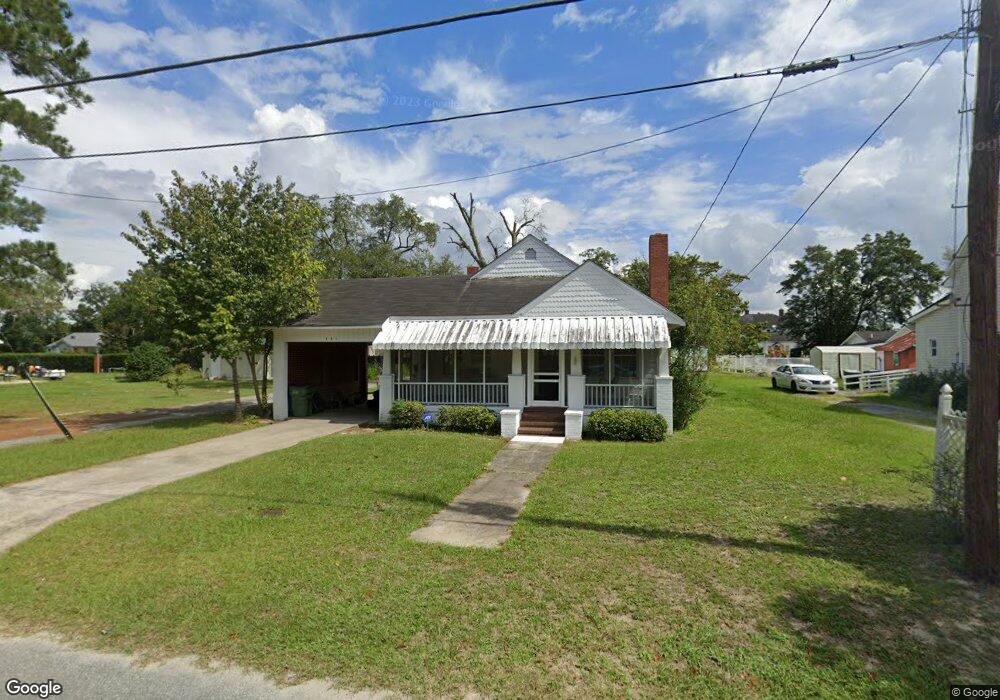
This home is located at 361 E Plum St, Jesup, GA 31546 and is currently estimated at $170,487, approximately $298 per square foot. 361 E Plum St is a home located in Wayne County with nearby schools including Jesup Elementary School, Arthur Williams Middle School, and Wayne County High School.
Ownership History
Date
Name
Owned For
Owner Type
Purchase Details
Closed on
Apr 24, 2025
Sold by
Williamson Linda Rinehart
Bought by
Cozy Nest Properties Llc
Current Estimated Value
Home Financials for this Owner
Home Financials are based on the most recent Mortgage that was taken out on this home.
Original Mortgage
$132,000
Outstanding Balance
$129,844
Interest Rate
6.65%
Mortgage Type
New Conventional
Estimated Equity
$40,643
Purchase Details
Closed on
Mar 5, 2010
Sold by
Strickland Wayne
Bought by
Williamson Linda Rinehart
Purchase Details
Closed on
Apr 1, 1995
Sold by
Harper Elwood H and Harper Williams
Bought by
Strickland Strickland J and Strickland Phyllis S
Purchase Details
Closed on
Oct 1, 1989
Bought by
Harper Elwood H and Harper Williams
Purchase Details
Closed on
Jan 1, 1989
Purchase Details
Closed on
Jul 1, 1985
Purchase Details
Closed on
Jan 1, 1983
Purchase Details
Closed on
May 1, 1982
Create a Home Valuation Report for This Property
The Home Valuation Report is an in-depth analysis detailing your home's value as well as a comparison with similar homes in the area
Purchase History
| Date | Buyer | Sale Price | Title Company |
|---|---|---|---|
| Cozy Nest Properties Llc | $165,000 | -- | |
| Williamson Linda Rinehart | $80,000 | -- | |
| Strickland Strickland J | $49,500 | -- | |
| Harper Elwood H | $49,000 | -- | |
| -- | $49,000 | -- | |
| -- | $48,500 | -- | |
| -- | $10,000 | -- | |
| -- | -- | -- |
Source: Public Records
Mortgage History
| Date | Status | Borrower | Loan Amount |
|---|---|---|---|
| Open | Cozy Nest Properties Llc | $132,000 |
Source: Public Records
Tax History
| Year | Tax Paid | Tax Assessment Tax Assessment Total Assessment is a certain percentage of the fair market value that is determined by local assessors to be the total taxable value of land and additions on the property. | Land | Improvement |
|---|---|---|---|---|
| 2025 | $1,301 | $41,233 | $3,350 | $37,883 |
| 2024 | $1,222 | $39,957 | $3,350 | $36,607 |
| 2023 | $764 | $26,013 | $3,330 | $22,683 |
| 2022 | $819 | $26,013 | $3,330 | $22,683 |
| 2021 | $877 | $26,013 | $3,330 | $22,683 |
| 2020 | $907 | $26,013 | $3,330 | $22,683 |
| 2019 | $934 | $26,013 | $3,330 | $22,683 |
| 2018 | $934 | $26,013 | $3,330 | $22,683 |
| 2017 | $804 | $26,013 | $3,330 | $22,683 |
| 2016 | $778 | $26,013 | $3,330 | $22,683 |
| 2014 | $780 | $26,013 | $3,330 | $22,683 |
| 2013 | -- | $26,012 | $3,330 | $22,682 |
Source: Public Records
Map
Nearby Homes
Your Personal Tour Guide
Ask me questions while you tour the home.