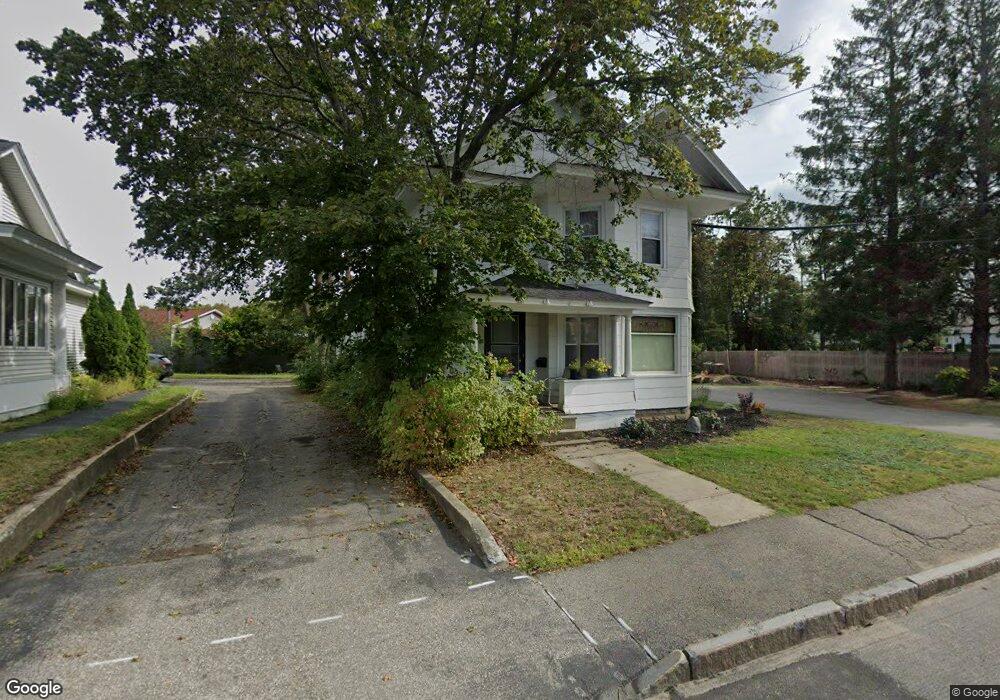
361 Elm St Biddeford, ME 04005
Estimated Value: $392,633 - $492,000
3
Beds
2
Baths
2,250
Sq Ft
$196/Sq Ft
Est. Value
About This Home
This home is located at 361 Elm St, Biddeford, ME 04005 and is currently estimated at $441,658, approximately $196 per square foot. 361 Elm St is a home located in York County with nearby schools including John F Kennedy Memorial School, Biddeford Primary School, and Biddeford Intermediate School.
Ownership History
Date
Name
Owned For
Owner Type
Purchase Details
Closed on
Oct 19, 2012
Sold by
Dancause Paul J
Bought by
Dancause Elizabeth S
Current Estimated Value
Purchase Details
Closed on
Sep 2, 2011
Sold by
Biddeford City Of
Bought by
Dancause Elizabeth S and Dancause Paul J
Purchase Details
Closed on
Jun 3, 2005
Sold by
Simard Antoinette H Est and Simard Normand E
Bought by
Simard Lucille T
Create a Home Valuation Report for This Property
The Home Valuation Report is an in-depth analysis detailing your home's value as well as a comparison with similar homes in the area
Home Values in the Area
Average Home Value in this Area
Purchase History
| Date | Buyer | Sale Price | Title Company |
|---|---|---|---|
| Dancause Elizabeth S | -- | -- | |
| Dancause Elizabeth S | -- | -- | |
| Simard Lucille T | -- | -- |
Source: Public Records
Tax History
| Year | Tax Paid | Tax Assessment Tax Assessment Total Assessment is a certain percentage of the fair market value that is determined by local assessors to be the total taxable value of land and additions on the property. | Land | Improvement |
|---|---|---|---|---|
| 2025 | $3,514 | $235,200 | $140,200 | $95,000 |
| 2024 | $3,320 | $233,500 | $140,200 | $93,300 |
| 2023 | $3,064 | $233,500 | $140,200 | $93,300 |
| 2022 | $3,116 | $189,900 | $76,200 | $113,700 |
| 2021 | $2,485 | $161,300 | $63,500 | $97,800 |
| 2020 | $6,349 | $145,300 | $54,000 | $91,300 |
| 2019 | $2,903 | $145,300 | $54,000 | $91,300 |
| 2018 | $2,154 | $145,300 | $54,000 | $91,300 |
| 2017 | $422 | $138,800 | $54,000 | $84,800 |
| 2016 | $2,757 | $138,800 | $54,000 | $84,800 |
| 2015 | $2,508 | $138,800 | $54,000 | $84,800 |
| 2014 | $2,446 | $138,800 | $54,000 | $84,800 |
| 2013 | -- | $137,700 | $59,800 | $77,900 |
Source: Public Records
Map
Nearby Homes
Your Personal Tour Guide
Ask me questions while you tour the home.