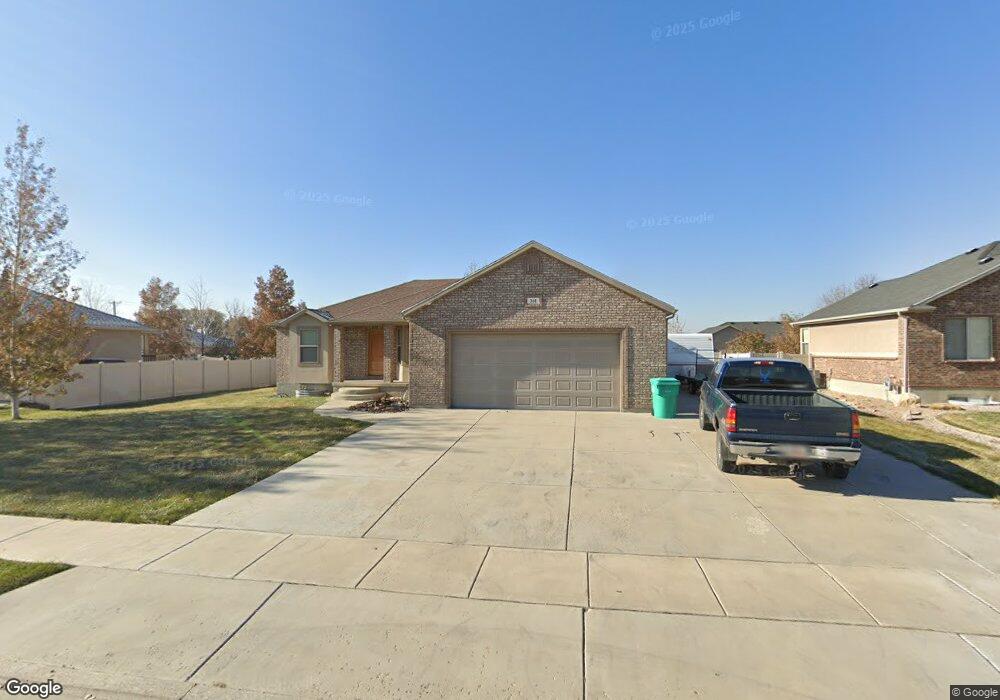
361 N 4920 W Clearfield, UT 84015
Estimated Value: $600,000 - $639,200
3
Beds
3
Baths
1,727
Sq Ft
$355/Sq Ft
Est. Value
About This Home
This home is located at 361 N 4920 W, Clearfield, UT 84015 and is currently estimated at $612,300, approximately $354 per square foot. 361 N 4920 W is a home with nearby schools including West Point School, West Point Junior High School, and Syracuse High School.
Ownership History
Date
Name
Owned For
Owner Type
Purchase Details
Closed on
May 12, 2006
Sold by
Rock Hard Construction Inc
Bought by
Butterfield Cory L and Butterfield Janet L
Current Estimated Value
Home Financials for this Owner
Home Financials are based on the most recent Mortgage that was taken out on this home.
Original Mortgage
$191,834
Interest Rate
6.3%
Mortgage Type
Fannie Mae Freddie Mac
Purchase Details
Closed on
Oct 19, 2005
Sold by
Abrams Doyle Dahl and Abrams Florence K
Bought by
Rock Hard Construction Inc
Home Financials for this Owner
Home Financials are based on the most recent Mortgage that was taken out on this home.
Original Mortgage
$196,800
Interest Rate
5.68%
Mortgage Type
Purchase Money Mortgage
Create a Home Valuation Report for This Property
The Home Valuation Report is an in-depth analysis detailing your home's value as well as a comparison with similar homes in the area
Home Values in the Area
Average Home Value in this Area
Purchase History
| Date | Buyer | Sale Price | Title Company |
|---|---|---|---|
| Butterfield Cory L | -- | Backman Title Services | |
| Rock Hard Construction Inc | -- | Bonneville Title Company |
Source: Public Records
Mortgage History
| Date | Status | Borrower | Loan Amount |
|---|---|---|---|
| Previous Owner | Butterfield Cory L | $191,834 | |
| Previous Owner | Rock Hard Construction Inc | $196,800 |
Source: Public Records
Tax History Compared to Growth
Tax History
| Year | Tax Paid | Tax Assessment Tax Assessment Total Assessment is a certain percentage of the fair market value that is determined by local assessors to be the total taxable value of land and additions on the property. | Land | Improvement |
|---|---|---|---|---|
| 2025 | $3,550 | $326,700 | $112,687 | $214,013 |
| 2024 | $3,458 | $319,549 | $101,451 | $218,098 |
| 2023 | $3,178 | $297,000 | $69,509 | $227,491 |
| 2022 | $3,499 | $592,000 | $119,484 | $472,516 |
| 2021 | $3,141 | $437,000 | $102,765 | $334,235 |
| 2020 | $2,745 | $376,000 | $86,316 | $289,684 |
| 2019 | $2,630 | $355,000 | $83,748 | $271,252 |
| 2018 | $2,491 | $331,000 | $83,784 | $247,216 |
| 2016 | $2,177 | $151,745 | $32,416 | $119,329 |
| 2015 | $2,157 | $142,505 | $32,416 | $110,089 |
| 2014 | $1,899 | $126,947 | $32,416 | $94,531 |
| 2013 | -- | $123,325 | $35,495 | $87,830 |
Source: Public Records
Map
Nearby Homes
- 4719 W 650 N
- 477 N 4500 W
- 4669 W 75 N
- 4594 W 75 N Unit 405
- 128 N 4500 W
- 4352 W 300 N
- 4366 W 200 N
- 4325 W 75 N
- 120 N 4325 W
- 4362 West St Unit 106
- 4358 West St Unit 105
- 357 N 4000 W
- 356 S 4300 W Unit 611
- 364 S 4300 W Unit 610
- 3949 W 250 N
- 4469 W 1000 N Unit 120
- Charleston Plan at Bluff View
- 3932 W 825 N Unit WF5
- 3918 W 825 N Unit WF6
- 114 3830 W