Estimated Value: $248,025 - $309,000
2
Beds
1
Bath
1,884
Sq Ft
$146/Sq Ft
Est. Value
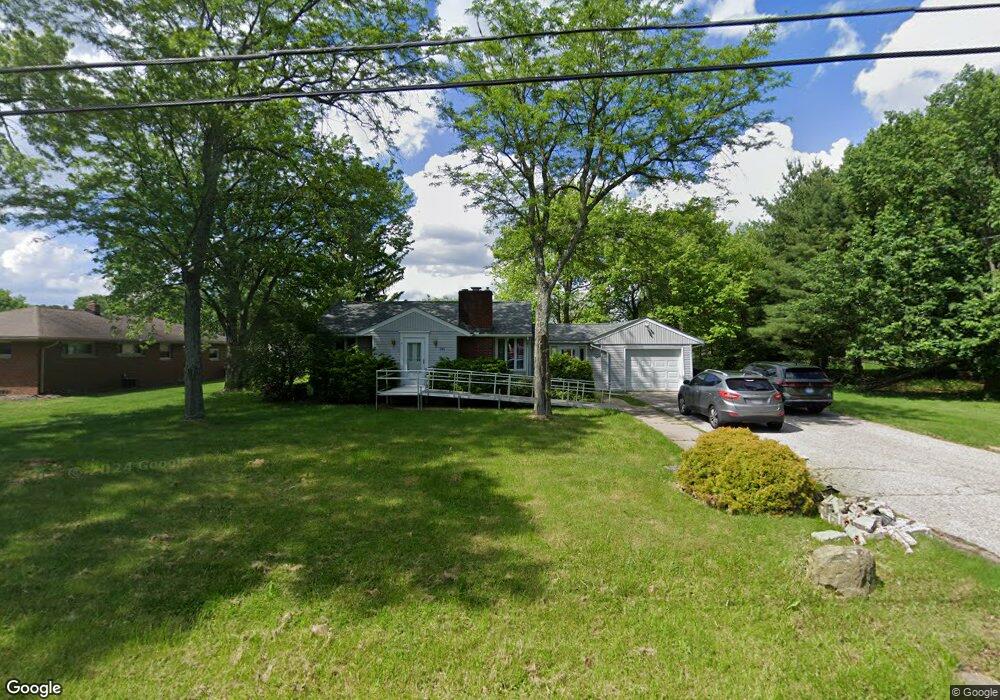
About This Home
This home is located at 361 N Messner Rd, Akron, OH 44319 and is currently estimated at $274,256, approximately $145 per square foot. 361 N Messner Rd is a home located in Summit County with nearby schools including Nolley Elementary School, Manchester Middle School, and Manchester High School.
Create a Home Valuation Report for This Property
The Home Valuation Report is an in-depth analysis detailing your home's value as well as a comparison with similar homes in the area
Home Values in the Area
Average Home Value in this Area
Tax History
| Year | Tax Paid | Tax Assessment Tax Assessment Total Assessment is a certain percentage of the fair market value that is determined by local assessors to be the total taxable value of land and additions on the property. | Land | Improvement |
|---|---|---|---|---|
| 2025 | $3,930 | $73,511 | $13,622 | $59,889 |
| 2024 | $3,843 | $73,511 | $13,622 | $59,889 |
| 2023 | $3,843 | $73,511 | $13,622 | $59,889 |
| 2022 | $3,510 | $52,276 | $9,660 | $42,616 |
| 2021 | $3,653 | $55,811 | $9,660 | $46,151 |
| 2020 | $3,691 | $55,810 | $9,660 | $46,150 |
| 2019 | $3,652 | $49,290 | $7,950 | $41,340 |
| 2018 | $3,174 | $49,290 | $7,950 | $41,340 |
| 2017 | $2,988 | $49,290 | $7,950 | $41,340 |
| 2016 | $2,953 | $42,680 | $7,950 | $34,730 |
| 2015 | $2,988 | $42,680 | $7,950 | $34,730 |
| 2014 | $2,966 | $42,680 | $7,950 | $34,730 |
| 2013 | $2,920 | $42,250 | $7,950 | $34,300 |
Source: Public Records
Map
Nearby Homes
- 5766 Weaver Rd
- 715 Highland Park Dr
- 771 Leeman Dr
- 477 Deborah Dr
- 5042 Laddie Dr
- 6407 Southview Dr
- 6235 Manchester Rd
- 6090 Manchester Rd Unit 6096
- 6 Shrakes Hotel Dr
- 4 Shrakes Hotel Dr
- 7 Shrakes Hotel Dr
- 427 Catalina Dr
- 5 Shrakes Hotel Dr
- 3 Shrakes Hotel Dr
- 4769 Cherimoya Ave
- lot 8 Whyem Dr
- 0 W Comet Rd Unit 5079117
- 4628 Whyem Dr
- 4472 Broadley Cir
- 4710 Pinecrest Dr
- 5557 Dailey Rd
- 350 N Messner Rd
- 340 N Messner Rd
- 341 N Messner Rd
- 360 N Messner Rd
- 5562 Dailey Rd
- 331 N Messner Rd
- 252 W Nimisila Rd
- 5552 Dailey Rd
- 244 W Nimisila Rd
- 262 W Nimisila Rd
- 324 N Messner Rd
- 230 W Nimisila Rd
- 230 W Nimisila Rd
- 323 N Messner Rd
- 5572 Dailey Rd
- 224 W Nimisila Rd
- 278 W Nimisila Rd
- 5582 Dailey Rd
- 318 N Messner Rd
Your Personal Tour Guide
Ask me questions while you tour the home.