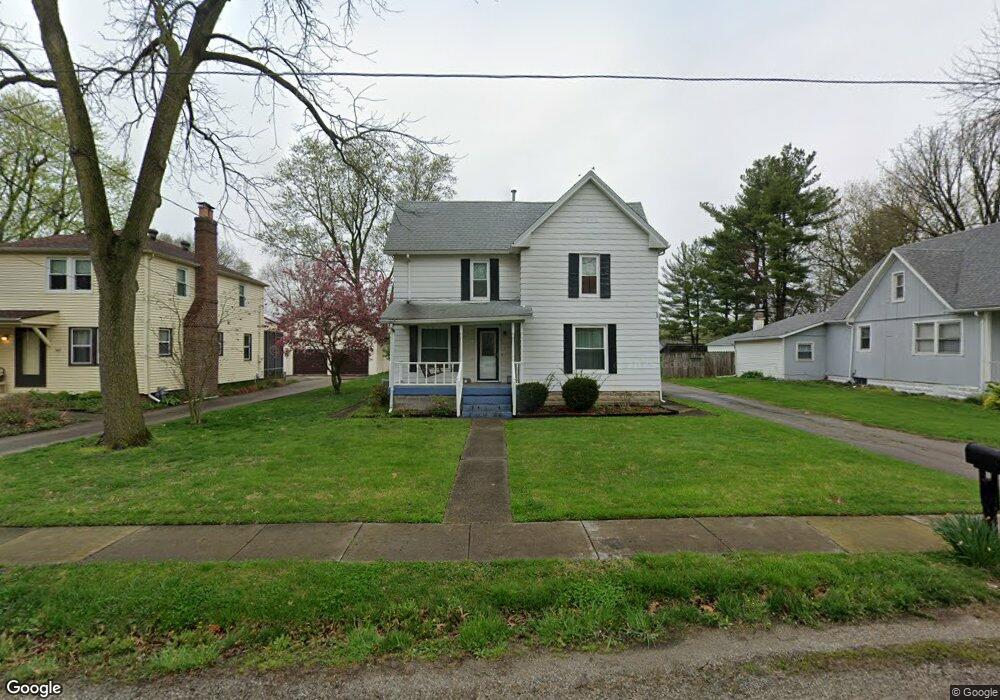
361 N Walnut St Rochester, IL 62563
Estimated Value: $186,221 - $283,000
--
Bed
--
Bath
--
Sq Ft
0.49
Acres
About This Home
This home is located at 361 N Walnut St, Rochester, IL 62563 and is currently estimated at $220,555. 361 N Walnut St is a home located in Sangamon County with nearby schools including Rochester Elementary Ec-1 School, Rochester Elementary School, and Rochester Intermediate School.
Create a Home Valuation Report for This Property
The Home Valuation Report is an in-depth analysis detailing your home's value as well as a comparison with similar homes in the area
Home Values in the Area
Average Home Value in this Area
Tax History Compared to Growth
Tax History
| Year | Tax Paid | Tax Assessment Tax Assessment Total Assessment is a certain percentage of the fair market value that is determined by local assessors to be the total taxable value of land and additions on the property. | Land | Improvement |
|---|---|---|---|---|
| 2024 | $2,973 | $55,462 | $10,975 | $44,487 |
| 2023 | $2,521 | $52,681 | $10,425 | $42,256 |
| 2022 | $2,903 | $49,882 | $9,871 | $40,011 |
| 2021 | $3,133 | $47,890 | $9,477 | $38,413 |
| 2020 | $3,071 | $47,275 | $9,355 | $37,920 |
| 2019 | $3,018 | $47,584 | $9,416 | $38,168 |
| 2018 | $2,987 | $46,821 | $9,265 | $37,556 |
| 2017 | $2,314 | $37,776 | $3,956 | $33,820 |
| 2016 | $2,231 | $36,541 | $3,827 | $32,714 |
| 2015 | $2,217 | $36,211 | $3,792 | $32,419 |
| 2014 | $2,199 | $35,945 | $3,764 | $32,181 |
| 2013 | $2,162 | $35,533 | $3,721 | $31,812 |
Source: Public Records
Map
Nearby Homes
- 427 Spring Ridge
- 217 E Main St Unit 1
- 525 E Mill St Unit 1
- 112 Deer Creek Rd Unit 1
- 1204 W Main St
- 5 Swannanoa Unit 1
- 27 Mishawaka Dr Unit 1
- 3440 Woodhaven Dr Unit 1
- 46 Woodland Trail
- 2265 Jostes Rd
- 3149 Beaver Creek Ln
- 3491 Woodhaven Dr
- 3810 Bristlecone Dr Unit 2
- 3120 Red Bud Ln
- 66 White Birch Rd
- 3504 Hoylake Dr
- 329-331 Harbor Point Place
- 312 Harbor Point Place
- 314 Harbor Point Place
- 9 Acadia Ct Unit 1
- 357 N Walnut St Unit 1
- 401 N Walnut St
- 353 N Walnut St Unit 1
- 405 N Walnut St Unit 1
- 400 N Walnut St Unit 1
- 409 N Walnut St Unit 1
- 412 N Walnut St Unit 1
- 345 N Walnut St
- 356 N Walnut St Unit 1
- 417 N Walnut St Unit 1
- 341 N Walnut St Unit 1
- 1 Katie Ln Unit 1
- 13 Circle Dr Unit 1
- 421 N Walnut St Unit 1
- 12 Circle Dr Unit 1
- 2 Katie Ln Unit 1
- 337 N Walnut St Unit 1
- 5 Katie Ln Unit 1
- 11 Circle Dr Unit 1
- 6 Katie Ln Unit 1