Estimated Value: $147,000 - $179,268
2
Beds
1
Bath
784
Sq Ft
$217/Sq Ft
Est. Value
About This Home
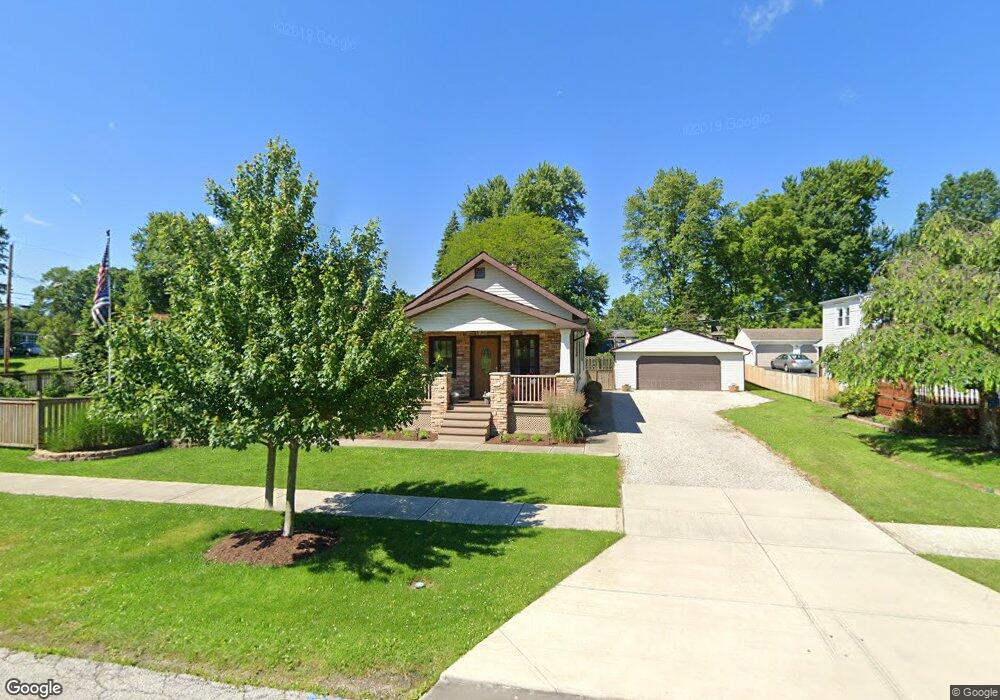
This home is located at 361 Runn St, Berea, OH 44017 and is currently estimated at $170,317, approximately $217 per square foot. 361 Runn St is a home located in Cuyahoga County with nearby schools including Grindstone Elementary School, Berea-Midpark Middle School, and Berea-Midpark High School.
Ownership History
Date
Name
Owned For
Owner Type
Purchase Details
Closed on
Apr 30, 1990
Sold by
Broestl Randall D
Bought by
Fahey Dale S
Current Estimated Value
Purchase Details
Closed on
Oct 28, 1980
Sold by
Buhaj Anthony and Buhaj Rosa
Bought by
Broestl Randall D
Purchase Details
Closed on
May 2, 1979
Sold by
Mary Buhaj
Bought by
Buhaj Anthony and Buhaj Rosa
Purchase Details
Closed on
Apr 10, 1979
Sold by
Buhaj Mary
Bought by
Mary Buhaj
Purchase Details
Closed on
Dec 7, 1977
Sold by
Buhaj Mary and Buhaj A
Bought by
Buhaj Mary
Purchase Details
Closed on
Jan 1, 1975
Bought by
Buhaj Mary and Buhaj A
Create a Home Valuation Report for This Property
The Home Valuation Report is an in-depth analysis detailing your home's value as well as a comparison with similar homes in the area
Home Values in the Area
Average Home Value in this Area
Purchase History
| Date | Buyer | Sale Price | Title Company |
|---|---|---|---|
| Fahey Dale S | $58,000 | -- | |
| Broestl Randall D | $41,500 | -- | |
| Buhaj Anthony | -- | -- | |
| Mary Buhaj | $29,400 | -- | |
| Buhaj Mary | -- | -- | |
| Buhaj Mary | -- | -- |
Source: Public Records
Tax History Compared to Growth
Tax History
| Year | Tax Paid | Tax Assessment Tax Assessment Total Assessment is a certain percentage of the fair market value that is determined by local assessors to be the total taxable value of land and additions on the property. | Land | Improvement |
|---|---|---|---|---|
| 2024 | $3,272 | $56,595 | $14,595 | $42,000 |
| 2023 | $2,836 | $41,060 | $14,910 | $26,150 |
| 2022 | $2,818 | $41,060 | $14,910 | $26,150 |
| 2021 | $2,794 | $41,060 | $14,910 | $26,150 |
| 2020 | $2,669 | $34,790 | $12,640 | $22,160 |
| 2019 | $2,598 | $99,400 | $36,100 | $63,300 |
| 2018 | $2,582 | $34,790 | $12,640 | $22,160 |
| 2017 | $2,437 | $30,460 | $8,580 | $21,880 |
| 2016 | $2,419 | $30,460 | $8,580 | $21,880 |
| 2015 | $2,380 | $30,460 | $8,580 | $21,880 |
| 2014 | $2,380 | $31,720 | $8,930 | $22,790 |
Source: Public Records
Map
Nearby Homes