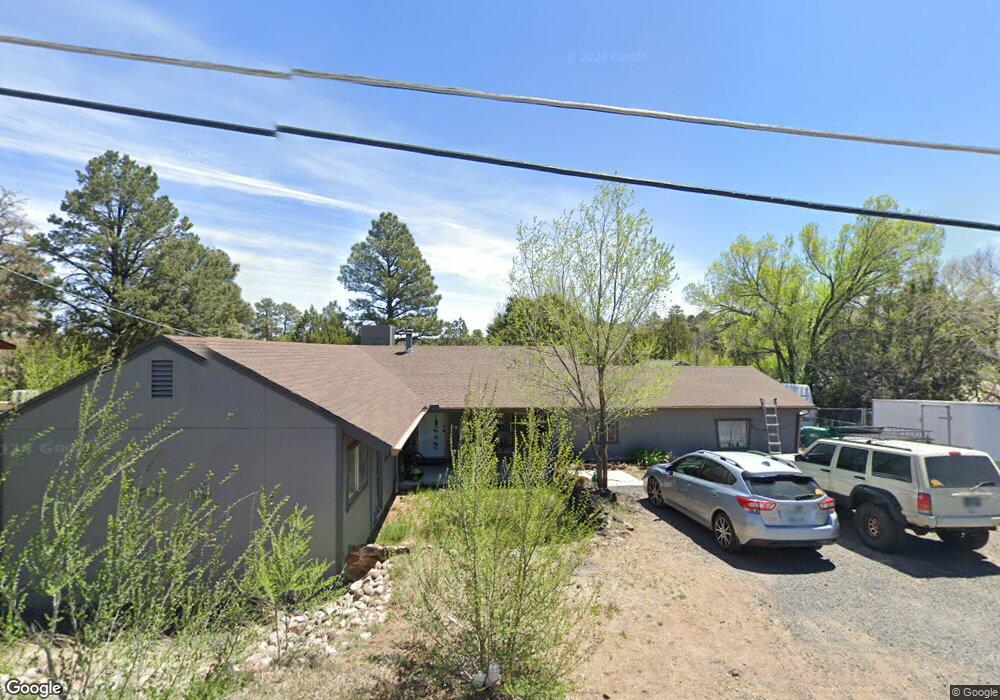
361 S 11th St Show Low, AZ 85901
Estimated Value: $306,000 - $364,000
4
Beds
2
Baths
69
Sq Ft
$4,798/Sq Ft
Est. Value
About This Home
This home is located at 361 S 11th St, Show Low, AZ 85901 and is currently estimated at $331,054, approximately $4,797 per square foot. 361 S 11th St is a home located in Navajo County with nearby schools including Nikolaus Homestead Elementary School, Show Low High School, and Show Low Junior High School.
Ownership History
Date
Name
Owned For
Owner Type
Purchase Details
Closed on
Mar 31, 2015
Sold by
3 Frogs Llc
Bought by
Graham Spencer I and Gutierrez Ana A
Current Estimated Value
Home Financials for this Owner
Home Financials are based on the most recent Mortgage that was taken out on this home.
Original Mortgage
$119,790
Outstanding Balance
$97,731
Interest Rate
5.5%
Mortgage Type
FHA
Estimated Equity
$233,323
Purchase Details
Closed on
Jun 4, 2014
Sold by
Anderson Mary Ann
Bought by
3 Frogs Lc
Purchase Details
Closed on
Dec 14, 2006
Sold by
Ellsworth Wesley M
Bought by
Anderson Mary Ann and Ellsworth Mary Ann
Home Financials for this Owner
Home Financials are based on the most recent Mortgage that was taken out on this home.
Original Mortgage
$50,000
Interest Rate
6.33%
Mortgage Type
New Conventional
Create a Home Valuation Report for This Property
The Home Valuation Report is an in-depth analysis detailing your home's value as well as a comparison with similar homes in the area
Home Values in the Area
Average Home Value in this Area
Purchase History
| Date | Buyer | Sale Price | Title Company |
|---|---|---|---|
| Graham Spencer I | $122,000 | Pioneer Title Agency | |
| 3 Frogs Lc | $50,000 | Lawyers Title | |
| Anderson Mary Ann | -- | Pioneer Title Agency |
Source: Public Records
Mortgage History
| Date | Status | Borrower | Loan Amount |
|---|---|---|---|
| Open | Graham Spencer I | $119,790 | |
| Previous Owner | Anderson Mary Ann | $50,000 |
Source: Public Records
Tax History Compared to Growth
Tax History
| Year | Tax Paid | Tax Assessment Tax Assessment Total Assessment is a certain percentage of the fair market value that is determined by local assessors to be the total taxable value of land and additions on the property. | Land | Improvement |
|---|---|---|---|---|
| 2026 | $1,172 | -- | -- | -- |
| 2025 | $1,153 | $23,181 | $2,410 | $20,771 |
| 2024 | $1,153 | $23,276 | $2,410 | $20,866 |
| 2023 | $1,153 | $18,435 | $2,001 | $16,434 |
| 2022 | $1,083 | $0 | $0 | $0 |
| 2021 | $1,098 | $0 | $0 | $0 |
| 2020 | $1,023 | $0 | $0 | $0 |
| 2019 | $1,023 | $0 | $0 | $0 |
| 2018 | $969 | $0 | $0 | $0 |
| 2017 | $885 | $0 | $0 | $0 |
| 2016 | $873 | $0 | $0 | $0 |
| 2015 | $824 | $7,886 | $1,515 | $6,372 |
Source: Public Records
Map
Nearby Homes
- 1001 E Owens
- 620 Campbell Ln
- 661 Campbell Ln
- 720 S Reynolds Ln
- 720 Reynolds Ln
- 721 S Reynolds Ln
- 201 S 6th Place
- 911 S 11th St
- 0 S 8th St Unit D
- 0 S 8th St Unit B 6917977
- 840 E Blue Jay
- 1420 E Meadow View Place
- 840 E Black Bear
- 181 Timber Ridge Loop
- 857 E Cooley St
- 1191 E Deuce of Clubs
- 1400 S 11th St
- 471 S Rockcreek Dr
- 2040 E Bluff Ridge Rd
- 960 S Ridgecreek Ln