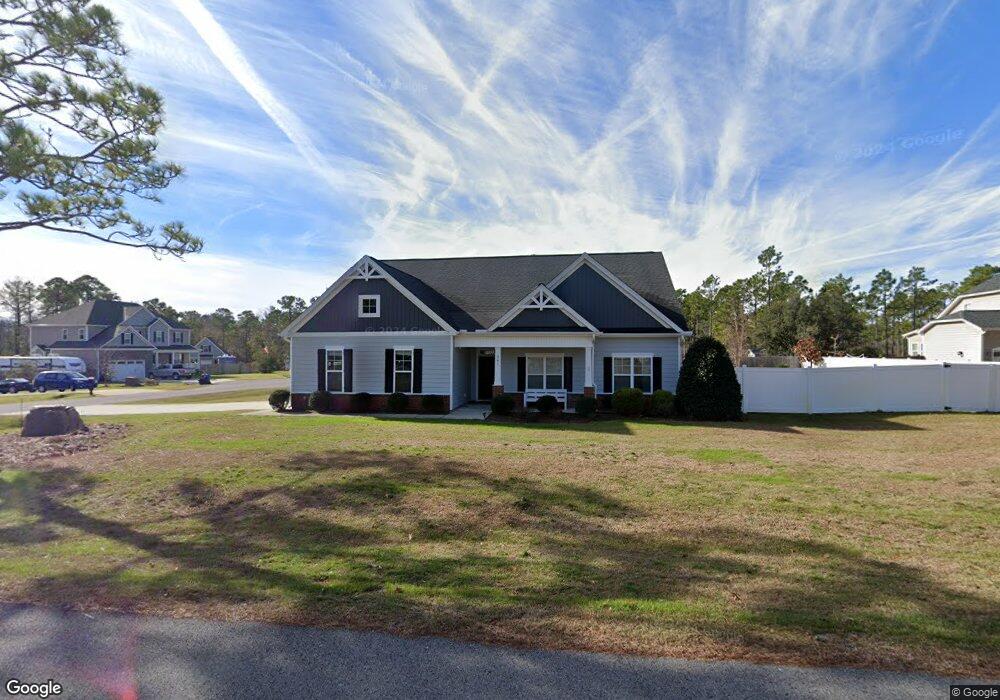
361 Scrub Oaks Hampstead, NC 28443
Estimated Value: $438,000 - $460,000
4
Beds
3
Baths
2,172
Sq Ft
$206/Sq Ft
Est. Value
About This Home
This home is located at 361 Scrub Oaks, Hampstead, NC 28443 and is currently estimated at $448,227, approximately $206 per square foot. 361 Scrub Oaks is a home located in Pender County with nearby schools including Topsail Elementary School, Topsail Middle School, and Topsail High School.
Ownership History
Date
Name
Owned For
Owner Type
Purchase Details
Closed on
May 18, 2021
Sold by
Ellis Justin A and Ellis Julie B
Bought by
Dike Christopher and Dike Judy
Current Estimated Value
Home Financials for this Owner
Home Financials are based on the most recent Mortgage that was taken out on this home.
Original Mortgage
$190,000
Outstanding Balance
$143,576
Interest Rate
3%
Mortgage Type
New Conventional
Estimated Equity
$304,651
Purchase Details
Closed on
Aug 21, 2013
Sold by
H&H Homes Of Fayetterville Llc
Bought by
Ellis Justin A and Ellis Julie B
Home Financials for this Owner
Home Financials are based on the most recent Mortgage that was taken out on this home.
Original Mortgage
$239,900
Interest Rate
4.31%
Mortgage Type
VA
Purchase Details
Closed on
Dec 17, 2012
Sold by
Pinnacle Property Of Hampstead Llc
Bought by
H & H Homes Of Fayetteville Llc
Create a Home Valuation Report for This Property
The Home Valuation Report is an in-depth analysis detailing your home's value as well as a comparison with similar homes in the area
Home Values in the Area
Average Home Value in this Area
Purchase History
| Date | Buyer | Sale Price | Title Company |
|---|---|---|---|
| Dike Christopher | $360,000 | None Available | |
| Ellis Justin A | $240,000 | None Available | |
| H & H Homes Of Fayetteville Llc | $240,000 | None Available |
Source: Public Records
Mortgage History
| Date | Status | Borrower | Loan Amount |
|---|---|---|---|
| Open | Dike Christopher | $190,000 | |
| Previous Owner | Ellis Justin A | $239,900 |
Source: Public Records
Tax History Compared to Growth
Tax History
| Year | Tax Paid | Tax Assessment Tax Assessment Total Assessment is a certain percentage of the fair market value that is determined by local assessors to be the total taxable value of land and additions on the property. | Land | Improvement |
|---|---|---|---|---|
| 2024 | $2,514 | $250,151 | $64,708 | $185,443 |
| 2023 | $2,514 | $250,151 | $64,708 | $185,443 |
| 2022 | $2,303 | $250,151 | $64,708 | $185,443 |
| 2021 | $2,303 | $250,151 | $64,708 | $185,443 |
| 2020 | $2,303 | $250,151 | $64,708 | $185,443 |
| 2019 | $2,303 | $250,151 | $64,708 | $185,443 |
| 2018 | $2,466 | $257,474 | $60,000 | $197,474 |
| 2017 | $2,466 | $257,474 | $60,000 | $197,474 |
| 2016 | $2,441 | $257,474 | $60,000 | $197,474 |
| 2015 | $2,406 | $257,474 | $60,000 | $197,474 |
| 2014 | $1,897 | $257,474 | $60,000 | $197,474 |
| 2013 | -- | $257,474 | $60,000 | $197,474 |
| 2012 | -- | $50,000 | $50,000 | $0 |
Source: Public Records
Map
Nearby Homes
- 123 Scrub Oaks Dr
- 64 Scrub Oaks Dr
- 1108 Terraces Ln
- 539 Sailor Sky Way
- 539 Sailor Sky Way Unit 391
- 556 Sailor Sky Way
- 568 Sailor Sky Way
- 556 Sailor Sky Way Unit 395
- 568 Sailor Sky Way Unit 394
- 542 Sailor Sky Way Unit 396
- 509 Sailor Sky Way Unit 389
- 107 Plank Ct
- 391 Topsail Plantation Dr
- 17 Hwy Off
- 609 Outrigger Ct
- 210 W Weatherbee Way
- 619 Outrigger Ct
- 63 N Flicker Meadow
- 123 Azalea Dr
- 281 W Weatherbee Way
- 361 Scrub Oaks Dr
- 42 Angel Oaks Dr
- 29 Angel Oaks
- 391 Scrub Oaks
- 42 Angel Oaks Dr
- 405 Scrub Oaks Dr
- 378 Scrub Oaks
- 356 Scrub Oaks
- 45 Angel Oaks Ct
- 396 Scrub Oaks
- 27 Angel Oaks
- 318 Scrub Oaks
- 28 Angel Oaks
- 41 Angel Oaks Ct
- 425 Scrub Oaks Dr
- 416 Scrub Oaks Dr
- 438 Scrub Oaks
- 447 Scrub Oaks Dr
- 305 Scrub Oaks
- 419 Pinnacle Pkwy Unit 55