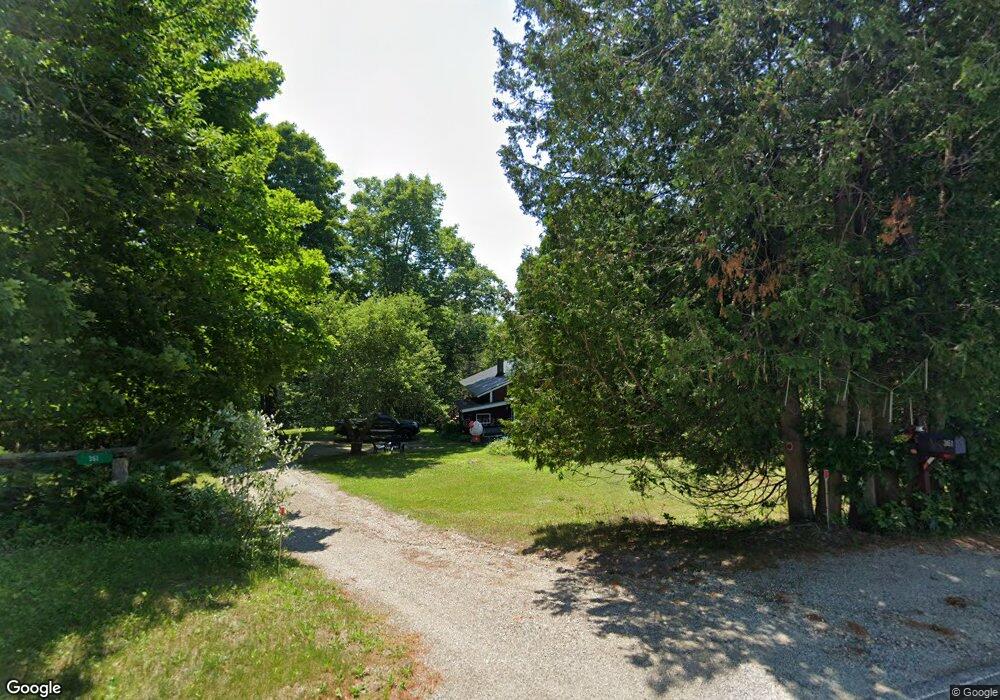
361 Surry Rd Orland, ME 04472
Estimated Value: $249,751 - $695,000
3
Beds
1
Bath
1,214
Sq Ft
$335/Sq Ft
Est. Value
About This Home
This home is located at 361 Surry Rd, Orland, ME 04472 and is currently estimated at $406,188, approximately $334 per square foot. 361 Surry Rd is a home located in Hancock County with nearby schools including G. Herbert Jewett School, Miles Lane School, and Bucksport Middle School.
Create a Home Valuation Report for This Property
The Home Valuation Report is an in-depth analysis detailing your home's value as well as a comparison with similar homes in the area
Home Values in the Area
Average Home Value in this Area
Tax History Compared to Growth
Tax History
| Year | Tax Paid | Tax Assessment Tax Assessment Total Assessment is a certain percentage of the fair market value that is determined by local assessors to be the total taxable value of land and additions on the property. | Land | Improvement |
|---|---|---|---|---|
| 2024 | $1,699 | $139,480 | $35,000 | $104,480 |
| 2023 | $1,643 | $139,480 | $35,000 | $104,480 |
| 2022 | $1,364 | $139,480 | $35,000 | $104,480 |
| 2021 | $1,337 | $87,410 | $18,250 | $69,160 |
| 2020 | $1,337 | $87,410 | $18,250 | $69,160 |
| 2019 | $1,355 | $87,410 | $18,250 | $69,160 |
| 2018 | $1,284 | $87,410 | $18,250 | $69,160 |
| 2017 | $1,219 | $87,410 | $18,250 | $69,160 |
| 2016 | $1,198 | $87,410 | $18,250 | $69,160 |
| 2015 | $1,198 | $87,410 | $18,250 | $69,160 |
| 2014 | $1,241 | $87,410 | $18,250 | $69,160 |
| 2013 | $1,241 | $87,410 | $18,250 | $69,160 |
Source: Public Records
Map
Nearby Homes
- 155 Long Point Way
- MAP19LOT28 Leach Rd
- 348 Back Ridge Rd
- 7 Grande View Rd
- 123 Front Ridge Rd
- 0 map 7/1 Ebens Trail
- 0 map 7/2 Ebens Trail
- 130 Hartview Cir
- Lot 37 Wedge Heights
- 00 Front Ridge Rd
- M4L15&16 Acadia Hwy
- MAP4LOT17 Acadia Hwy
- Lot #15 Toddy Pond Rd
- 10-10 Toddy Pond Rd
- 160 Front Ridge Rd
- 9 Meadow Brook Ln
- 41 Wildwood Ln
- 194 Branchview Dr
- 248 Branchview Dr
- 0 Meadow Brook Ln
- 355 Surry Rd
- 0 Surry Rd
- Lot 3 Off Route 176
- Lot 2 Off Route 176
- Lot 1 Off Route 176
- 45 Town Line Way
- 15 Freilino Way
- 32 Freilino Way
- 16 Freilino Way
- 381 Surry Rd
- 72 Freilino Way
- 52 Freilino Way
- 335 Surry Rd
- 47 Town Line Way
- 327 Surry Rd
- 336 Surry Rd
- 0 Town Line Rd
- 23 Skyhawk Way
- 19 Skyhawk Way
- 19 & 23 Skyhawk Way