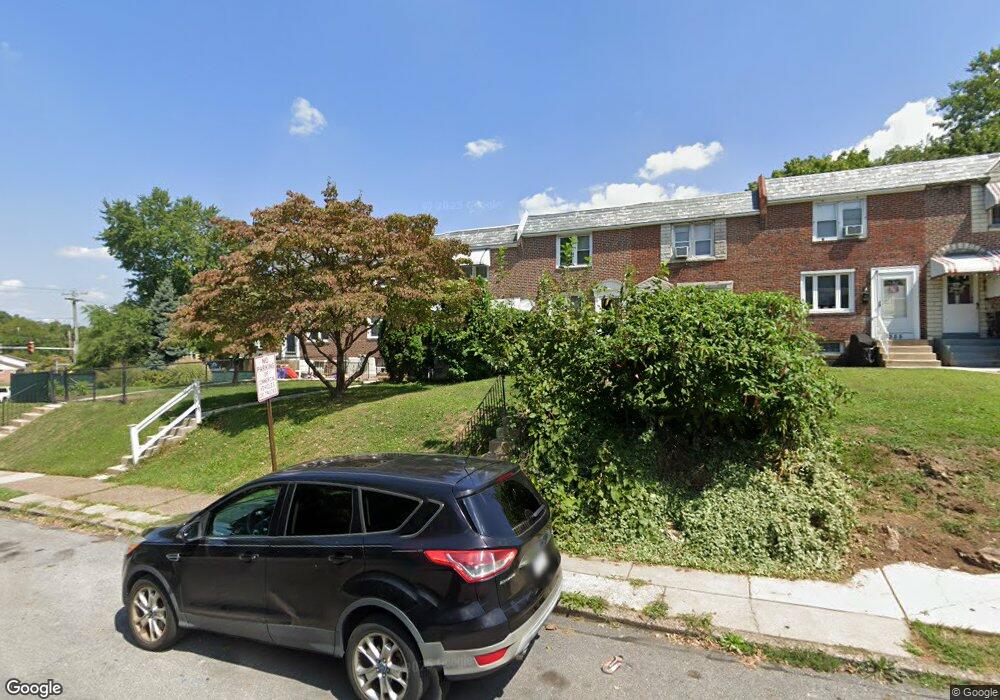
361 Westpark Ln Clifton Heights, PA 19018
Estimated Value: $166,000 - $243,000
3
Beds
1
Bath
1,152
Sq Ft
$188/Sq Ft
Est. Value
About This Home
This home is located at 361 Westpark Ln, Clifton Heights, PA 19018 and is currently estimated at $216,391, approximately $187 per square foot. 361 Westpark Ln is a home located in Delaware County with nearby schools including Westbrook Park El School, Drexel Hill Middle School, and Upper Darby High School.
Ownership History
Date
Name
Owned For
Owner Type
Purchase Details
Closed on
Apr 15, 2019
Sold by
Warrington Shaw Llc
Bought by
Natow Jason
Current Estimated Value
Home Financials for this Owner
Home Financials are based on the most recent Mortgage that was taken out on this home.
Original Mortgage
$60,000
Outstanding Balance
$52,643
Interest Rate
4.2%
Mortgage Type
New Conventional
Estimated Equity
$163,748
Purchase Details
Closed on
Jun 22, 2018
Sold by
Sansone Annamarie L and The Estate Of Mary M Mcneill
Bought by
Warrington Shaw Llc
Home Financials for this Owner
Home Financials are based on the most recent Mortgage that was taken out on this home.
Original Mortgage
$63,000
Interest Rate
4.6%
Mortgage Type
Construction
Purchase Details
Closed on
Dec 14, 1983
Sold by
Martin John and Martin Caline M
Bought by
Mcneill Richard Charles and Mcneill Mary M
Create a Home Valuation Report for This Property
The Home Valuation Report is an in-depth analysis detailing your home's value as well as a comparison with similar homes in the area
Home Values in the Area
Average Home Value in this Area
Purchase History
| Date | Buyer | Sale Price | Title Company |
|---|---|---|---|
| Natow Jason | $80,000 | First Platinum Abstract Llc | |
| Warrington Shaw Llc | $75,000 | Ts Executive Abstract Llc | |
| Mcneill Richard Charles | $54,900 | -- |
Source: Public Records
Mortgage History
| Date | Status | Borrower | Loan Amount |
|---|---|---|---|
| Open | Natow Jason | $60,000 | |
| Previous Owner | Warrington Shaw Llc | $63,000 |
Source: Public Records
Tax History Compared to Growth
Tax History
| Year | Tax Paid | Tax Assessment Tax Assessment Total Assessment is a certain percentage of the fair market value that is determined by local assessors to be the total taxable value of land and additions on the property. | Land | Improvement |
|---|---|---|---|---|
| 2025 | $4,293 | $101,520 | $24,120 | $77,400 |
| 2024 | $4,293 | $101,520 | $24,120 | $77,400 |
| 2023 | $4,253 | $101,520 | $24,120 | $77,400 |
| 2022 | $4,139 | $101,520 | $24,120 | $77,400 |
| 2021 | $5,580 | $101,520 | $24,120 | $77,400 |
| 2020 | $5,507 | $85,140 | $24,120 | $61,020 |
| 2019 | $5,411 | $85,140 | $24,120 | $61,020 |
| 2018 | $5,348 | $85,140 | $0 | $0 |
| 2017 | $5,209 | $85,140 | $0 | $0 |
| 2016 | $467 | $85,140 | $0 | $0 |
| 2015 | $477 | $85,140 | $0 | $0 |
| 2014 | $467 | $85,140 | $0 | $0 |
Source: Public Records
Map
Nearby Homes
- 5232 Gramercy Dr
- 5226 Gramercy Dr
- 399 N Sycamore Ave
- 5159 Gramercy Dr
- 5137 Westley Dr
- 274 N Oak Ave
- 5134 Westley Dr
- 5201 Whitehall Dr
- 5122 Whitehall Dr
- 232 Crestwood Dr
- 245 Gramercy Dr
- 289 Whitehall Dr
- 235 W Wyncliffe Ave
- 401 N Sycamore Ave
- 5237 N Springfield Rd
- 403 N Sycamore Ave
- 207 N Bishop Ave
- 397 N Sycamore Ave
- 5331 Brittany Dr
- 5208 Fairhaven Rd
- 359 Westpark Ln
- 363 Westpark Ln
- 357 Westpark Ln
- 365 Westpark Ln
- 355 Westpark Ln
- 353 Westpark Ln
- 351 Westpark Ln
- 5265 Palmer Mill Rd
- 5263 Palmer Mill Rd
- 5261 Palmer Mill Rd
- 349 Westpark Ln
- 5259 Palmer Mill Rd
- 339 Westpark Ln
- 347 Westpark Ln
- 5257 Palmer Mill Rd
- 5255 Palmer Mill Rd
- 345 Westpark Ln
- 5253 Palmer Mill Rd
- 5260 Palmer Mill Rd
- 343 Westpark Ln