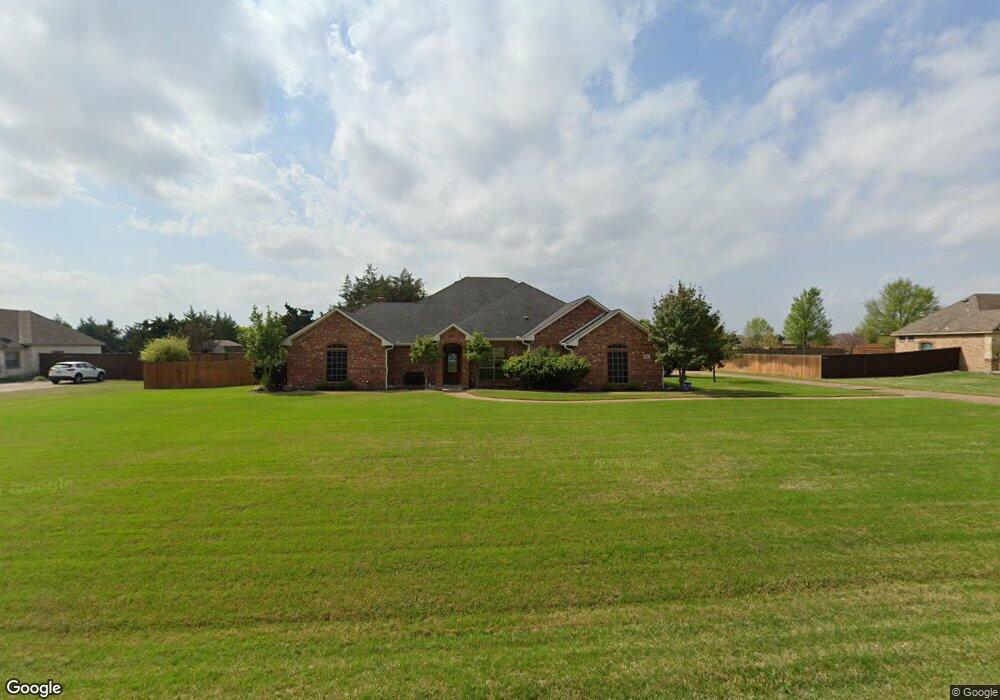
3610 Billy Ray Rd Midlothian, TX 76065
Estimated Value: $684,064 - $781,000
3
Beds
3
Baths
3,008
Sq Ft
$244/Sq Ft
Est. Value
About This Home
This home is located at 3610 Billy Ray Rd, Midlothian, TX 76065 and is currently estimated at $732,532, approximately $243 per square foot. 3610 Billy Ray Rd is a home located in Ellis County with nearby schools including Larue Miller Elementary School and Frank Seale Middle School.
Ownership History
Date
Name
Owned For
Owner Type
Purchase Details
Closed on
Jun 12, 2018
Sold by
Tupy David Michael and Tupy Jennifer Lynn
Bought by
Granstaff Ruthann L and Granstaff Houston
Current Estimated Value
Home Financials for this Owner
Home Financials are based on the most recent Mortgage that was taken out on this home.
Original Mortgage
$371,450
Outstanding Balance
$321,242
Interest Rate
4.5%
Mortgage Type
Stand Alone First
Estimated Equity
$411,290
Purchase Details
Closed on
May 30, 2013
Sold by
Cathey John P and Cathey Wanda K
Bought by
Tupy David Michael and Tupy Jennifer Lynn
Home Financials for this Owner
Home Financials are based on the most recent Mortgage that was taken out on this home.
Original Mortgage
$152,500
Interest Rate
3.43%
Mortgage Type
New Conventional
Purchase Details
Closed on
May 6, 2005
Sold by
Manor On The Green Lp
Bought by
Cathey John P and Cathey Wanda K
Create a Home Valuation Report for This Property
The Home Valuation Report is an in-depth analysis detailing your home's value as well as a comparison with similar homes in the area
Home Values in the Area
Average Home Value in this Area
Purchase History
| Date | Buyer | Sale Price | Title Company |
|---|---|---|---|
| Granstaff Ruthann L | -- | Old Republic Title | |
| Tupy David Michael | -- | None Available | |
| Cathey John P | -- | None Available |
Source: Public Records
Mortgage History
| Date | Status | Borrower | Loan Amount |
|---|---|---|---|
| Open | Granstaff Ruthann L | $371,450 | |
| Previous Owner | Tupy David Michael | $152,500 |
Source: Public Records
Tax History
| Year | Tax Paid | Tax Assessment Tax Assessment Total Assessment is a certain percentage of the fair market value that is determined by local assessors to be the total taxable value of land and additions on the property. | Land | Improvement |
|---|---|---|---|---|
| 2025 | $5,754 | $645,536 | $145,000 | $500,536 |
| 2024 | $5,754 | $590,192 | -- | -- |
| 2023 | $5,754 | $536,538 | $0 | $0 |
| 2022 | $8,128 | $487,762 | $0 | $0 |
| 2021 | $10,665 | $443,420 | $70,000 | $373,420 |
| 2020 | $10,222 | $406,360 | $70,000 | $336,360 |
| 2019 | $11,102 | $423,940 | $0 | $0 |
| 2017 | $9,449 | $354,980 | $40,000 | $314,980 |
| 2016 | $8,673 | $325,810 | $40,000 | $285,810 |
Source: Public Records
Map
Nearby Homes
- 3421 Mindy Ln
- 3650 Baylor Blvd
- 3250 Katy Kourt E
- 4651 Spring Garden Rd
- 6071 Sage Oaks Ct
- 3840 Angela Ct
- 3240 Caleb Ct E
- 3231 Plainview Rd
- 3051 Plainview Rd
- 4611 Stout Rd
- 4840 Monroe Dr
- 3291 Plainview Rd
- 3831 Jack's Loop
- 3611 Skinner Rd
- 3841 Ledgestone Ln
- 3601 Plainview Rd
- 3620 Willow Creek Dr
- 2866 Shane Dr
- 2837 Midlake Dr
- 3870 Ledgestone Ln
- 3620 Billy Ray Rd
- 3440 Billy Ray Rd
- 3611 Billy Ray Rd
- 3430 Billy Ray Rd
- 3621 Laura Ct
- 3441 Billy Ray Rd
- 3621 Billy Ray Rd
- 3631 Laura Ct
- 3431 Billy Ray Rd
- 3611 Laura Ct
- 3640 Billy Ray Rd
- 3631 Billy Ray Rd
- 3421 Billy Ray Rd
- 3610 Laura Ct
- 3620 Laura Ct
- 3630 Laura Ct
- 4020 Josh Ct
- 4010 Josh Ct
- 3651 Laura Ct
- 4030 Josh Ct
Your Personal Tour Guide
Ask me questions while you tour the home.