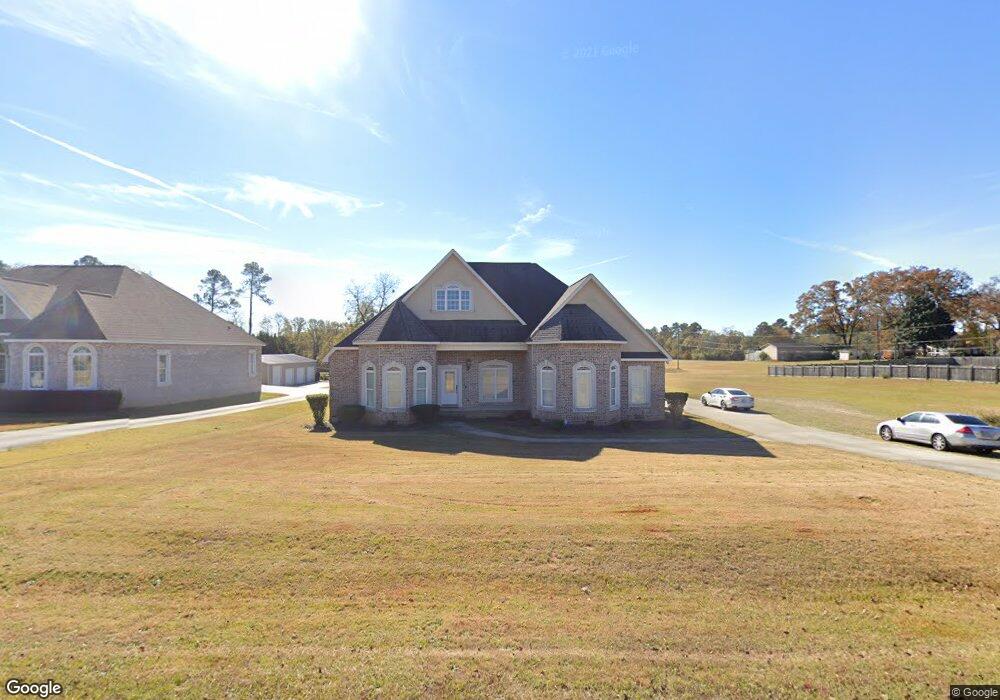
3610 Jones Rd Macon, GA 31216
Estimated Value: $334,831 - $365,000
4
Beds
4
Baths
2,837
Sq Ft
$124/Sq Ft
Est. Value
About This Home
This home is located at 3610 Jones Rd, Macon, GA 31216 and is currently estimated at $350,458, approximately $123 per square foot. 3610 Jones Rd is a home located in Bibb County with nearby schools including Heard Elementary School, Rutland Middle School, and Rutland High School.
Ownership History
Date
Name
Owned For
Owner Type
Purchase Details
Closed on
May 19, 2010
Sold by
Hurst Angela and Griggs Benjamin
Bought by
Chester Marlon J and Chester Tamika L
Current Estimated Value
Home Financials for this Owner
Home Financials are based on the most recent Mortgage that was taken out on this home.
Original Mortgage
$235,600
Outstanding Balance
$158,079
Interest Rate
5.15%
Mortgage Type
New Conventional
Estimated Equity
$192,379
Purchase Details
Closed on
Mar 25, 2009
Sold by
Barnes Lisa S
Bought by
Hurst Angela and Griggs Benjamin
Purchase Details
Closed on
Oct 30, 2008
Sold by
Windmill Inc
Bought by
Barnes Lisa S
Home Financials for this Owner
Home Financials are based on the most recent Mortgage that was taken out on this home.
Original Mortgage
$204,000
Interest Rate
6.11%
Mortgage Type
Construction
Create a Home Valuation Report for This Property
The Home Valuation Report is an in-depth analysis detailing your home's value as well as a comparison with similar homes in the area
Home Values in the Area
Average Home Value in this Area
Purchase History
| Date | Buyer | Sale Price | Title Company |
|---|---|---|---|
| Chester Marlon J | $248,000 | None Available | |
| Hurst Angela | $260,000 | None Available | |
| Barnes Lisa S | $55,000 | None Available |
Source: Public Records
Mortgage History
| Date | Status | Borrower | Loan Amount |
|---|---|---|---|
| Open | Chester Marlon J | $235,600 | |
| Previous Owner | Barnes Lisa S | $204,000 |
Source: Public Records
Tax History Compared to Growth
Tax History
| Year | Tax Paid | Tax Assessment Tax Assessment Total Assessment is a certain percentage of the fair market value that is determined by local assessors to be the total taxable value of land and additions on the property. | Land | Improvement |
|---|---|---|---|---|
| 2025 | $3,175 | $136,220 | $4,218 | $132,002 |
| 2024 | $3,282 | $136,220 | $4,218 | $132,002 |
| 2023 | $2,825 | $136,220 | $4,218 | $132,002 |
| 2022 | $3,760 | $115,614 | $6,400 | $109,214 |
| 2021 | $4,105 | $115,014 | $5,800 | $109,214 |
| 2020 | $4,194 | $115,014 | $5,800 | $109,214 |
| 2019 | $4,228 | $115,014 | $5,800 | $109,214 |
| 2018 | $6,655 | $115,014 | $5,800 | $109,214 |
| 2017 | $4,047 | $115,014 | $5,800 | $109,214 |
| 2016 | $3,737 | $115,014 | $5,800 | $109,214 |
| 2015 | $5,290 | $115,014 | $5,800 | $109,214 |
| 2014 | $1,766 | $115,014 | $5,800 | $109,214 |
Source: Public Records
Map
Nearby Homes
- 3606 Jones Rd
- 3630 Jones Rd
- 3542 Jones Rd
- 3549 Jones Rd
- 3528 Jones Rd
- 3621 Jones Rd
- 3640 Jones Rd
- 3649 Jones Rd
- 3527 Jones Rd
- 3514 Jones Rd
- 171 Stonefield Cir
- 3508 Jones Rd
- 177 Stonefield Cir
- 3620 Jones Rd
- 3657 Jones Rd
- 3511 Jones Rd
- 181 Stonefield Cir
- 3660 Jones Rd
- 165 Stonefield Cir
- 0 Stonefield Cir Unit 7422817