3610 Phifer Rd Wingate, NC 28174
Estimated Value: $404,000 - $5,847,000
3
Beds
1
Bath
1,372
Sq Ft
$1,731/Sq Ft
Est. Value
About This Home
This home is located at 3610 Phifer Rd, Wingate, NC 28174 and is currently estimated at $2,374,271, approximately $1,730 per square foot. 3610 Phifer Rd is a home located in Union County with nearby schools including Wingate Elementary School, East Union Middle School, and Forest Hills High School.
Ownership History
Date
Name
Owned For
Owner Type
Purchase Details
Closed on
Oct 11, 2023
Sold by
Bulldog Investment Holdings Llc
Bought by
M I Homes Of Charlotte Llc
Current Estimated Value
Purchase Details
Closed on
Aug 19, 2022
Sold by
Bulldog Investments Holdings Llc
Bought by
Cbm Supply Llc
Purchase Details
Closed on
May 3, 2021
Sold by
Robin Revon Hinson Davis and Norris Rona
Bought by
Bulldog Investment Holdings Llc
Purchase Details
Closed on
Dec 5, 2017
Sold by
Davis Norris Ronald and The Wriston Arthur Davis And C
Bought by
Davis Robin Revon Hinson and Davis Norris Ronald
Purchase Details
Closed on
Jul 19, 2005
Sold by
Davis W Arthur and Davis Clara B
Bought by
Davis Wriston Arthur and Davis Clara Belle
Create a Home Valuation Report for This Property
The Home Valuation Report is an in-depth analysis detailing your home's value as well as a comparison with similar homes in the area
Home Values in the Area
Average Home Value in this Area
Purchase History
| Date | Buyer | Sale Price | Title Company |
|---|---|---|---|
| M I Homes Of Charlotte Llc | $5,914,000 | None Listed On Document | |
| M I Homes Of Charlotte Llc | $5,914,000 | None Listed On Document | |
| Cbm Supply Llc | -- | Purser & Glenn Pllc | |
| Cbm Supply Llc | -- | Purser & Glenn Pllc | |
| Cbm Supply Llc | -- | Purser & Glenn Pllc | |
| Bulldog Investment Holdings Llc | $2,700 | None Listed On Document | |
| Bulldog Investment Holdings Llc | $2,700 | Palmer Robert D | |
| Bulldog Investment Holdings Llc | $1,350,000 | Chicago Title Insurance Co | |
| Davis Robin Revon Hinson | -- | Chicago Title Insurance Comp | |
| Davis Wriston Arthur | -- | Chicago Title Insurance Comp |
Source: Public Records
Tax History Compared to Growth
Tax History
| Year | Tax Paid | Tax Assessment Tax Assessment Total Assessment is a certain percentage of the fair market value that is determined by local assessors to be the total taxable value of land and additions on the property. | Land | Improvement |
|---|---|---|---|---|
| 2025 | $6,236 | $824,800 | $0 | $0 |
| 2024 | $4,670 | $460,800 | $460,800 | $0 |
| 2023 | $9,119 | $916,500 | $460,800 | $455,700 |
| 2022 | $11,264 | $1,132,100 | $462,500 | $669,600 |
| 2021 | $1,070 | $163,600 | $66,700 | $96,900 |
| 2020 | $758 | $127,830 | $42,530 | $85,300 |
| 2019 | $792 | $127,830 | $42,530 | $85,300 |
| 2018 | $792 | $127,830 | $42,530 | $85,300 |
| 2017 | $839 | $127,800 | $42,500 | $85,300 |
| 2016 | $825 | $127,830 | $42,530 | $85,300 |
| 2015 | $834 | $127,830 | $42,530 | $85,300 |
| 2014 | $782 | $101,050 | $33,060 | $67,990 |
Source: Public Records
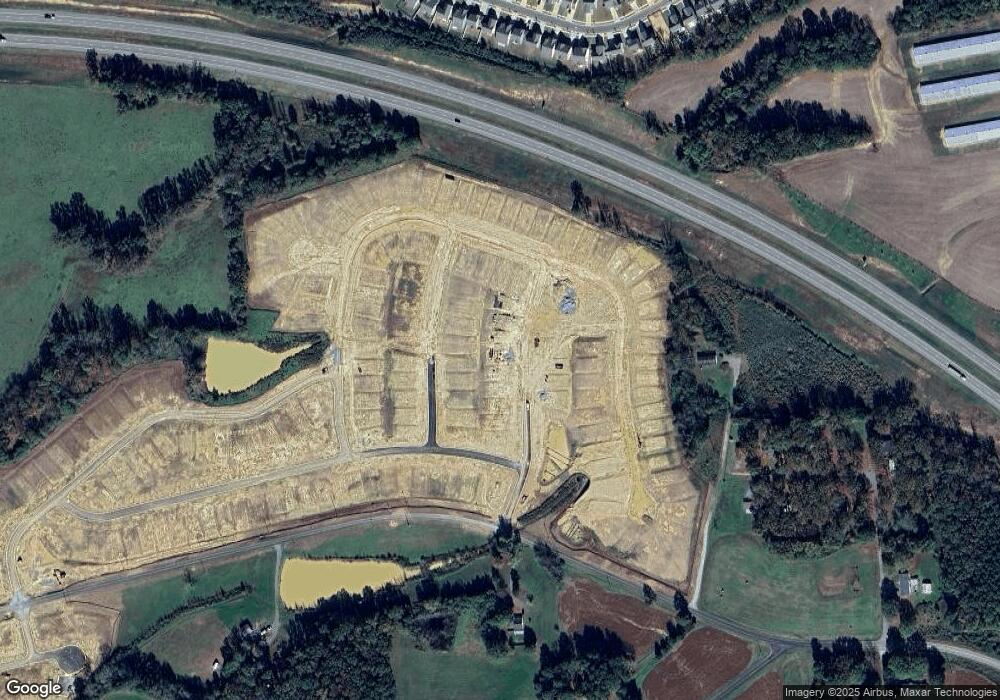
Map
Nearby Homes
- 1137 Overbrook Place
- 1133 Overbrook Place
- 1129 Overbrook Place
- 1115 Overbrook Place
- 1111 Overbrook Place
- Bexley II Plan at Canterbury Station - Single Family Series
- Vernon Plan at Canterbury Station - Single Family Series
- Savoy II Plan at Canterbury Station - Single Family Series
- Catawba Plan at Canterbury Station - Townhomes
- Draper II Plan at Canterbury Station - Single Family Series
- Erie II Plan at Canterbury Station - Single Family Series
- Wylie II Plan at Canterbury Station - Townhomes
- Dearborn II Plan at Canterbury Station - Single Family Series
- 1216 Fremont Dr
- Meadow Plan at Canterbury Station - Single Family Series
- Crawford Plan at Canterbury Station - Single Family Series
- Manchester Plan at Canterbury Station - Townhomes
- Findlay II Plan at Canterbury Station - Single Family Series
- 1107 Overbrook Place
- 1030 Overbrook Place
- 1304 Fremont Dr
- 3625 Phifer Rd
- 3520 Phifer Rd
- 3517 Phifer Rd
- 3813 Zeb Goodman Rd
- 3708 Phifer Rd
- 720 Ansonville Rd
- 3909 Zeb Goodman Rd
- 616 Ansonville Rd
- 703 Ansonville Rd
- 3607 Zeb Goodman Rd
- 00 Ansonville Rd
- 615 Ansonville Rd
- 3810 Phifer Rd
- 604 E Wilson St
- 100 Ann Perry St
- 601 E Wilson St
- 104 Ann Perry St
- 00 Ann Perry St
- 108 Ann Perry St