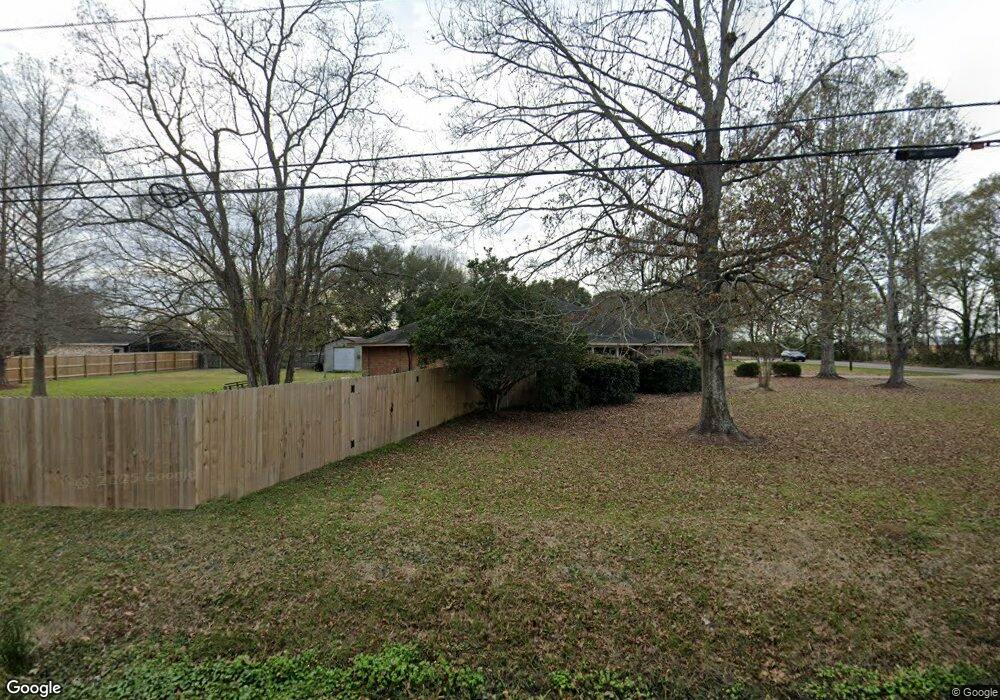
3610 Rollins Rd Zachary, LA 70791
Estimated Value: $232,000 - $260,000
3
Beds
2
Baths
1,710
Sq Ft
$143/Sq Ft
Est. Value
About This Home
This home is located at 3610 Rollins Rd, Zachary, LA 70791 and is currently estimated at $244,203, approximately $142 per square foot. 3610 Rollins Rd is a home located in East Baton Rouge Parish with nearby schools including Northwestern Elementary School, Rollins Place Elementary School, and Zachary Elementary School.
Ownership History
Date
Name
Owned For
Owner Type
Purchase Details
Closed on
Apr 21, 2005
Sold by
Milligan Douglas
Bought by
Davis Marcus
Current Estimated Value
Home Financials for this Owner
Home Financials are based on the most recent Mortgage that was taken out on this home.
Original Mortgage
$139,900
Outstanding Balance
$72,709
Interest Rate
5.89%
Mortgage Type
New Conventional
Estimated Equity
$171,494
Purchase Details
Closed on
Feb 1, 2000
Sold by
Johnson William D and Johnson Valerie P
Bought by
Milligan Douglas and Milligan Penny
Home Financials for this Owner
Home Financials are based on the most recent Mortgage that was taken out on this home.
Original Mortgage
$104,077
Interest Rate
7.13%
Mortgage Type
FHA
Purchase Details
Closed on
Oct 16, 1998
Sold by
Stark Leroy Joel
Bought by
Johnson William D and Johnson Valerie P
Home Financials for this Owner
Home Financials are based on the most recent Mortgage that was taken out on this home.
Original Mortgage
$90,746
Interest Rate
6.81%
Mortgage Type
FHA
Create a Home Valuation Report for This Property
The Home Valuation Report is an in-depth analysis detailing your home's value as well as a comparison with similar homes in the area
Home Values in the Area
Average Home Value in this Area
Purchase History
| Date | Buyer | Sale Price | Title Company |
|---|---|---|---|
| Davis Marcus | $139,900 | -- | |
| Milligan Douglas | $104,900 | -- | |
| Johnson William D | $92,900 | -- |
Source: Public Records
Mortgage History
| Date | Status | Borrower | Loan Amount |
|---|---|---|---|
| Open | Davis Marcus | $139,900 | |
| Previous Owner | Milligan Douglas | $104,077 | |
| Previous Owner | Johnson William D | $90,746 |
Source: Public Records
Tax History Compared to Growth
Tax History
| Year | Tax Paid | Tax Assessment Tax Assessment Total Assessment is a certain percentage of the fair market value that is determined by local assessors to be the total taxable value of land and additions on the property. | Land | Improvement |
|---|---|---|---|---|
| 2024 | $1,340 | $17,741 | $1,602 | $16,139 |
| 2023 | $1,340 | $15,840 | $1,430 | $14,410 |
| 2022 | $1,987 | $15,840 | $1,430 | $14,410 |
| 2021 | $1,987 | $15,840 | $1,430 | $14,410 |
| 2020 | $2,005 | $15,840 | $1,430 | $14,410 |
| 2019 | $2,005 | $14,400 | $1,300 | $13,100 |
| 2018 | $2,012 | $14,400 | $1,300 | $13,100 |
| 2017 | $2,012 | $14,400 | $1,300 | $13,100 |
| 2016 | $985 | $14,400 | $1,300 | $13,100 |
| 2015 | $898 | $14,000 | $1,300 | $12,700 |
| 2014 | $895 | $14,000 | $1,300 | $12,700 |
| 2013 | -- | $14,000 | $1,300 | $12,700 |
Source: Public Records
Map
Nearby Homes
- 3411 Chien St
- 3420 Chien St
- 3430 Chien St
- 3421 Chien St
- 3410 Chien St
- 3440 Chien St
- 3508 Ash St
- 3542 Chien St
- 3503 Chien St
- 7043 Brook Hollow Dr
- 7003 Brook Hollow Dr
- 7013 Brook Hollow Dr
- 6961 Brook Hollow Dr
- 7023 Brook Hollow Dr
- Kenner Plan at Brook Hollow
- 3523 Chien St
- Lacombe Plan at Brook Hollow
- Ozark Plan at Brook Hollow
- Eastwood Plan at Brook Hollow
- Evergreen Plan at Brook Hollow