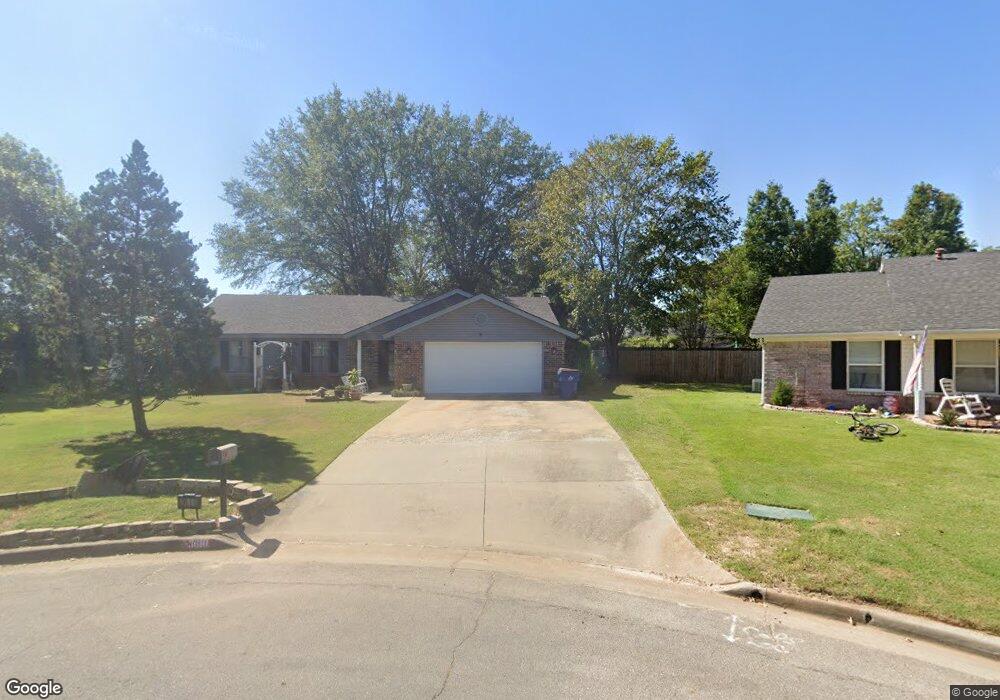
3610 S 95th Cir Fort Smith, AR 72903
Estimated Value: $181,000 - $231,000
--
Bed
2
Baths
1,528
Sq Ft
$127/Sq Ft
Est. Value
About This Home
This home is located at 3610 S 95th Cir, Fort Smith, AR 72903 and is currently estimated at $194,817, approximately $127 per square foot. 3610 S 95th Cir is a home located in Sebastian County with nearby schools including John P. Woods Elementary School, L.A. Chaffin Junior High School, and Southside High School.
Ownership History
Date
Name
Owned For
Owner Type
Purchase Details
Closed on
Nov 18, 2011
Sold by
Hudgens Teresa and Hudgens Larry D
Bought by
Clark Molly and Clark Alex
Current Estimated Value
Home Financials for this Owner
Home Financials are based on the most recent Mortgage that was taken out on this home.
Original Mortgage
$116,958
Outstanding Balance
$78,585
Interest Rate
3.87%
Mortgage Type
FHA
Estimated Equity
$116,232
Purchase Details
Closed on
Aug 13, 2009
Sold by
Latta Kim and Hudgens Teresa
Bought by
Hudgens Teresa and Latta Kim
Purchase Details
Closed on
Aug 31, 1989
Bought by
Latta Doris A
Purchase Details
Closed on
Jun 1, 1989
Bought by
Federal National Mortgage Asso
Purchase Details
Closed on
Jun 5, 1984
Bought by
Chappell Chappell J and Chappell Cathy
Purchase Details
Closed on
Jul 9, 1976
Bought by
Wowrey Dough E and George Anne
Create a Home Valuation Report for This Property
The Home Valuation Report is an in-depth analysis detailing your home's value as well as a comparison with similar homes in the area
Home Values in the Area
Average Home Value in this Area
Purchase History
| Date | Buyer | Sale Price | Title Company |
|---|---|---|---|
| Clark Molly | $120,000 | None Available | |
| Hudgens Teresa | -- | None Available | |
| Latta Doris A | $51,000 | -- | |
| Federal National Mortgage Asso | -- | -- | |
| Chappell Chappell J | $59,000 | -- | |
| Perkins Lawrence H | $44,000 | -- | |
| Wowrey Dough E | $30,000 | -- |
Source: Public Records
Mortgage History
| Date | Status | Borrower | Loan Amount |
|---|---|---|---|
| Open | Clark Molly | $116,958 |
Source: Public Records
Tax History Compared to Growth
Tax History
| Year | Tax Paid | Tax Assessment Tax Assessment Total Assessment is a certain percentage of the fair market value that is determined by local assessors to be the total taxable value of land and additions on the property. | Land | Improvement |
|---|---|---|---|---|
| 2025 | $1,318 | $32,483 | $5,600 | $26,883 |
| 2024 | $1,135 | $21,620 | $4,000 | $17,620 |
| 2023 | $830 | $21,620 | $4,000 | $17,620 |
| 2022 | $880 | $21,620 | $4,000 | $17,620 |
| 2021 | $880 | $21,620 | $4,000 | $17,620 |
| 2020 | $283 | $11,340 | $4,000 | $7,340 |
| 2019 | $333 | $21,390 | $4,000 | $17,390 |
| 2018 | $892 | $21,390 | $4,000 | $17,390 |
| 2017 | $773 | $21,390 | $4,000 | $17,390 |
| 2016 | $1,123 | $21,390 | $4,000 | $17,390 |
| 2015 | $773 | $21,390 | $4,000 | $17,390 |
| 2014 | $939 | $24,550 | $3,600 | $20,950 |
Source: Public Records
Map
Nearby Homes
- 9313 Enid St
- 9912 Turtle Bay
- 10000 Turtle Bay
- 3021 S 96th St
- 2908 Riverbend Dr
- 10008 Foxboro Rd
- 10112 Meandering Way
- 3001 Brighton Point
- 9005 Lakeside Way
- 10101 Foxboro Rd
- 3008 Lake Overlook Ct
- 3004 Lake Overlook Ct
- 2912 S 100th St
- 2411 Wyndermere Way
- 4011 Logan Ln
- 2811 Brighton Ct
- 4616 S 96th St
- 10717 Hunters Point Rd
- 4811 Oak Hollow Ln
- 2500 Pine Ln
- 3606 S 95th Cir
- 3612 S 95th Cir
- 3609 Eastland Cir
- 3605 Eastland Cir
- 3600 S 95th Cir
- 3609 S 95th Cir
- 3601 Eastland Cir
- 3605 S 95th Cir
- 3612 Eastland Cir
- 3601 S 95th Cir
- 9409 Houston St
- 9413 Houston St
- 3610 Eastland Cir
- 9405 Houston St
- 3606 Eastland Cir
- 9401 Houston St
- 9501 Houston St
- 3600 Eastland Cir
- 9505 S Houston St
- 9505 Houston St