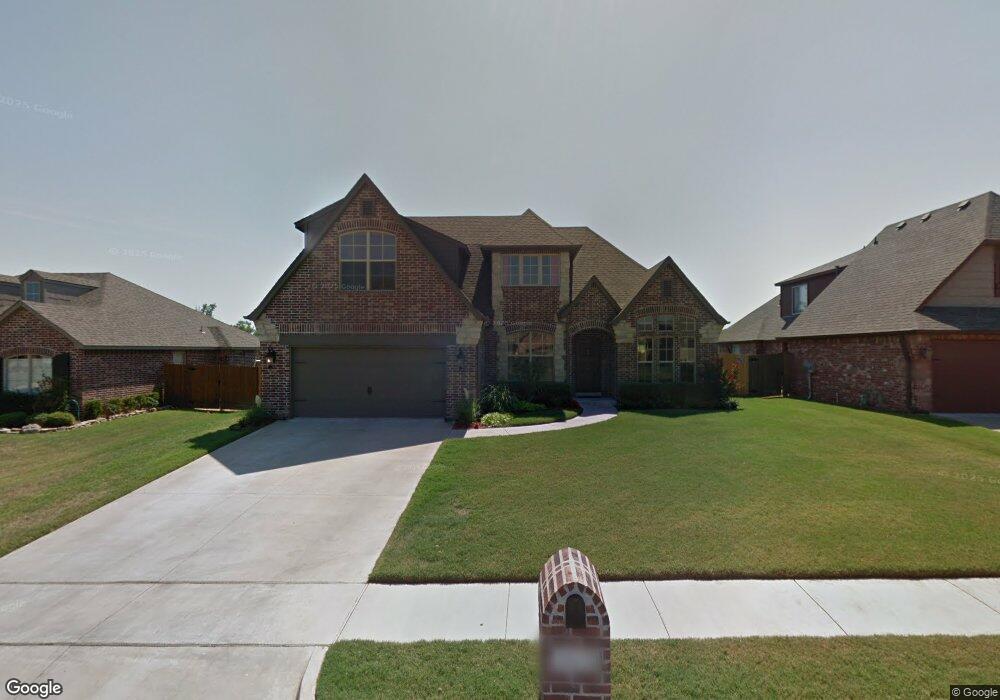
3610 W 109th St S Sapulpa, OK 74066
Estimated Value: $396,769 - $419,000
--
Bed
2
Baths
2,662
Sq Ft
$154/Sq Ft
Est. Value
About This Home
This home is located at 3610 W 109th St S, Sapulpa, OK 74066 and is currently estimated at $409,442, approximately $153 per square foot. 3610 W 109th St S is a home located in Tulsa County with nearby schools including Jenks West Elementary School, Jenks West Intermediate Elementary School, and Jenks Middle School.
Ownership History
Date
Name
Owned For
Owner Type
Purchase Details
Closed on
Aug 6, 2025
Sold by
Graham Karl and Graham Lindsey
Bought by
Grahamland Llc
Current Estimated Value
Purchase Details
Closed on
Jun 25, 2019
Sold by
Holdman Kenneth and Holdman Stacy L
Bought by
Graham Karl and Graham Karl
Home Financials for this Owner
Home Financials are based on the most recent Mortgage that was taken out on this home.
Original Mortgage
$247,500
Interest Rate
3.9%
Mortgage Type
New Conventional
Purchase Details
Closed on
Jul 5, 2011
Sold by
Sooter Rodney B and Sooter Salena N
Bought by
Holdman Kenneth and Holdman Stacy L
Home Financials for this Owner
Home Financials are based on the most recent Mortgage that was taken out on this home.
Original Mortgage
$270,650
Interest Rate
4.65%
Mortgage Type
VA
Create a Home Valuation Report for This Property
The Home Valuation Report is an in-depth analysis detailing your home's value as well as a comparison with similar homes in the area
Home Values in the Area
Average Home Value in this Area
Purchase History
| Date | Buyer | Sale Price | Title Company |
|---|---|---|---|
| Grahamland Llc | -- | None Listed On Document | |
| Graham Karl | $275,000 | Firstitle & Abstract Svcs Ll | |
| Holdman Kenneth | $270,000 | None Available |
Source: Public Records
Mortgage History
| Date | Status | Borrower | Loan Amount |
|---|---|---|---|
| Previous Owner | Graham Karl | $247,500 | |
| Previous Owner | Holdman Kenneth | $270,650 |
Source: Public Records
Tax History Compared to Growth
Tax History
| Year | Tax Paid | Tax Assessment Tax Assessment Total Assessment is a certain percentage of the fair market value that is determined by local assessors to be the total taxable value of land and additions on the property. | Land | Improvement |
|---|---|---|---|---|
| 2024 | $4,038 | $32,697 | $3,453 | $29,244 |
| 2023 | $4,038 | $32,716 | $3,682 | $29,034 |
| 2022 | $4,083 | $31,762 | $4,204 | $27,558 |
| 2021 | $3,939 | $30,250 | $4,004 | $26,246 |
| 2020 | $3,852 | $30,250 | $4,004 | $26,246 |
| 2019 | $3,680 | $28,700 | $3,869 | $24,831 |
| 2018 | $3,705 | $28,700 | $3,869 | $24,831 |
| 2017 | $3,644 | $29,700 | $4,004 | $25,696 |
| 2016 | $3,734 | $29,700 | $4,004 | $25,696 |
| 2015 | $3,805 | $29,700 | $4,004 | $25,696 |
| 2014 | $3,891 | $29,700 | $4,004 | $25,696 |
Source: Public Records
Map
Nearby Homes
- 3710 W 110th St S
- 3706 W 106th St S
- 10910 S Olmsted St
- 10732 S 33rd West Ave
- 2957 W 114th Place S
- 11275 S Douglas Ave
- 11009 Augusta Dr
- 10417 S 33rd West Ave
- 10739 Masters Cir
- 11608 S Union Ave
- 10317 S Nathan St
- 11602 S 30th West Ave
- 2629 W 115th St S
- 11710 S Willow Place
- 2012 W 109th St S
- 11728 S Willow Place
- 11206 S Redbud St
- 12002 S Vine St
- 12108 S Elm St
- 12009 S Umber St
- 3612 W 109th St S
- 3608 W 109th St S
- 3606 W 109th St S
- 3614 W 109th St S
- 11002 S Kennedy St
- 3613 W 109th St S
- 3611 W 109th St S
- 3615 W 109th St S
- 3609 W 109th St S
- 3604 W 109th St S
- 11005 S Kennedy St
- 3617 W 109th St S
- 3607 W 109th St S
- 10917 S Lawrence St
- 10917 S Lawrence St
- 11010 S Kennedy St
- 3704 W 109th St S
- 10919 S Lawrence St
- 10919 S Lawrence St
- 3605 W 109th St S