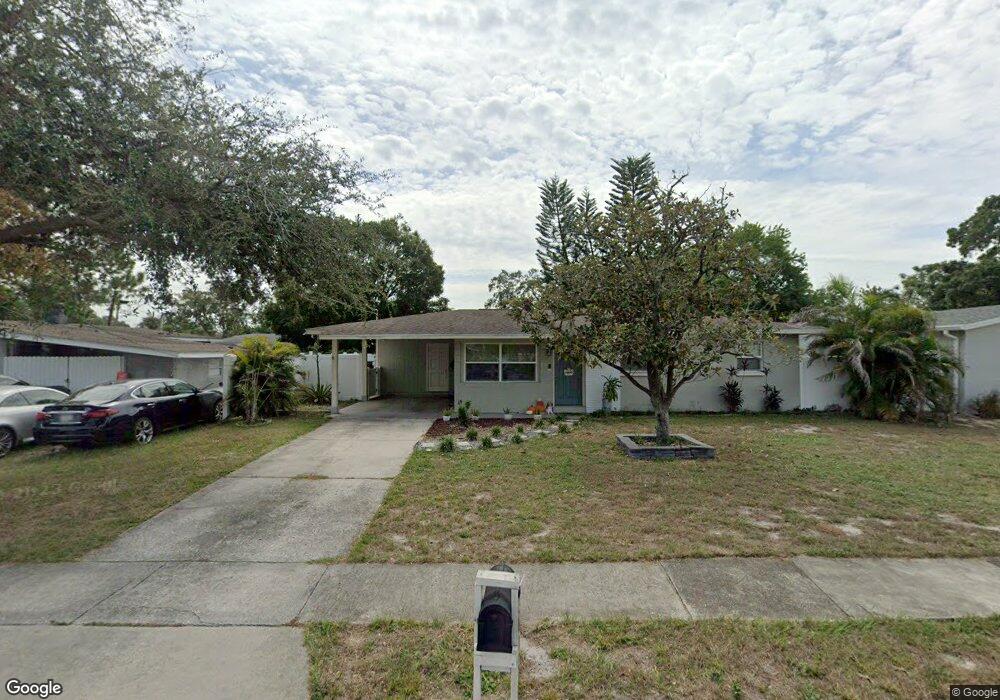
3610 W Tyson Ave Tampa, FL 33611
Sun Bay South NeighborhoodEstimated Value: $356,000 - $369,000
3
Beds
1
Bath
1,370
Sq Ft
$264/Sq Ft
Est. Value
About This Home
This home is located at 3610 W Tyson Ave, Tampa, FL 33611 and is currently estimated at $362,208, approximately $264 per square foot. 3610 W Tyson Ave is a home located in Hillsborough County with nearby schools including Chiaramonte Elementary School, Madison Middle School, and Robinson High School.
Ownership History
Date
Name
Owned For
Owner Type
Purchase Details
Closed on
Aug 28, 2025
Sold by
Richards Gina Renee and Baez Gina Renee
Bought by
Bphb Assetco Llc
Current Estimated Value
Purchase Details
Closed on
May 5, 2017
Sold by
Castellvi Danielle M and Maxwell Travis
Bought by
Richards Gina Renee
Home Financials for this Owner
Home Financials are based on the most recent Mortgage that was taken out on this home.
Original Mortgage
$179,193
Interest Rate
4.62%
Mortgage Type
FHA
Purchase Details
Closed on
Nov 30, 2009
Sold by
Whitney One Llc
Bought by
Castellvi Danielle M
Home Financials for this Owner
Home Financials are based on the most recent Mortgage that was taken out on this home.
Original Mortgage
$122,735
Interest Rate
4.98%
Mortgage Type
FHA
Purchase Details
Closed on
Jul 20, 2009
Sold by
Payne Timothy R
Bought by
Whitney One Llc
Purchase Details
Closed on
Mar 8, 2004
Sold by
Payne Chad and Payne James Chad
Bought by
Payne Tracy Lynn and Payne Timothy R
Create a Home Valuation Report for This Property
The Home Valuation Report is an in-depth analysis detailing your home's value as well as a comparison with similar homes in the area
Home Values in the Area
Average Home Value in this Area
Purchase History
| Date | Buyer | Sale Price | Title Company |
|---|---|---|---|
| Bphb Assetco Llc | $300,000 | First American Title Insurance | |
| Richards Gina Renee | $182,500 | La Maison Title Llc | |
| Castellvi Danielle M | $125,000 | Whitworth Title Group Inc | |
| Whitney One Llc | $50,500 | None Available | |
| Payne Tracy Lynn | $17,742 | -- |
Source: Public Records
Mortgage History
| Date | Status | Borrower | Loan Amount |
|---|---|---|---|
| Previous Owner | Richards Gina Renee | $179,193 | |
| Previous Owner | Castellvi Danielle M | $122,735 |
Source: Public Records
Tax History Compared to Growth
Tax History
| Year | Tax Paid | Tax Assessment Tax Assessment Total Assessment is a certain percentage of the fair market value that is determined by local assessors to be the total taxable value of land and additions on the property. | Land | Improvement |
|---|---|---|---|---|
| 2024 | $2,700 | $175,697 | -- | -- |
| 2023 | $2,621 | $170,580 | $0 | $0 |
| 2022 | $2,542 | $165,612 | $0 | $0 |
| 2021 | $2,502 | $160,788 | $0 | $0 |
| 2020 | $2,413 | $155,772 | $0 | $0 |
| 2019 | $2,355 | $152,270 | $0 | $0 |
| 2018 | $2,326 | $149,431 | $0 | $0 |
| 2017 | $2,231 | $102,008 | $0 | $0 |
| 2016 | $660 | $53,297 | $0 | $0 |
| 2015 | $623 | $52,927 | $0 | $0 |
| 2014 | $578 | $52,507 | $0 | $0 |
| 2013 | -- | $51,731 | $0 | $0 |
Source: Public Records
Map
Nearby Homes
- 3502 W Rogers Ave
- 5402 S Himes Ave
- 3702 W Wallace Ave
- 5302 S Himes Ave
- 3410 W Rogers Ave
- 3612 W Pearl Ave
- 3401 W Wyoming Cir Unit 2
- 3810 W Leila Ave
- 3402 W Wyoming Cir
- 3814 W Tyson Ave
- 3311 W Paxton Ave
- 3308 W Wyoming Cir
- 3711 W Iowa Ave Unit 214
- 3522 W Price Ave
- 3308 W Wyoming Ave
- 3909 W Oklahoma Ave
- 3213 Serenity Estates Ln
- 3207 W Pearl Ave
- 3209 Serenity Estates Ln
- 3202 W Tyson Ave
- 3608 W Tyson Ave
- 3612 W Tyson Ave
- 3609 W Wallace Ave
- 3611 W Wallace Ave
- 3611 W Ave
- 3607 W Wallace Ave
- 3606 W Tyson Ave
- 3614 W Tyson Ave
- 3609 W Tyson Ave
- 3613 W Wallace Ave
- 3611 W Tyson Ave
- 3607 W Tyson Ave
- 3605 W Wallace Ave
- 3613 W Tyson Ave
- 3616 W Tyson Ave
- 3605 W Tyson Ave
- 3604 W Tyson Ave
- 3615 W Wallace Ave
- 3603 W Wallace Ave
- 3615 W Tyson Ave