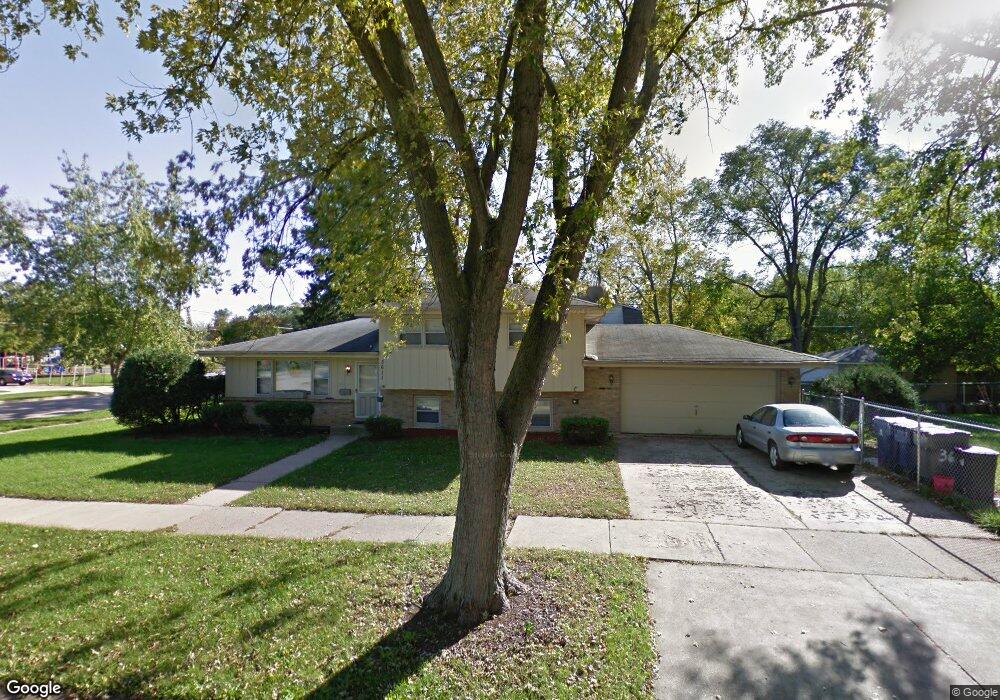
3611 212th Place Matteson, IL 60443
Old Matteson NeighborhoodEstimated Value: $159,000 - $215,922
3
Beds
2
Baths
1,073
Sq Ft
$176/Sq Ft
Est. Value
About This Home
This home is located at 3611 212th Place, Matteson, IL 60443 and is currently estimated at $189,231, approximately $176 per square foot. 3611 212th Place is a home located in Cook County with nearby schools including Illinois School, Matteson Elementary School, and Sauk Elementary School.
Ownership History
Date
Name
Owned For
Owner Type
Purchase Details
Closed on
May 7, 2015
Sold by
Rivera Felipe A and Rios Jilberto
Bought by
Flores Edgar
Current Estimated Value
Home Financials for this Owner
Home Financials are based on the most recent Mortgage that was taken out on this home.
Original Mortgage
$79,800
Outstanding Balance
$62,181
Interest Rate
4%
Mortgage Type
New Conventional
Estimated Equity
$127,050
Purchase Details
Closed on
Dec 5, 2014
Sold by
Royal Savings Bank
Bought by
Rivera Felipe A and Rios Jilberto
Purchase Details
Closed on
Jan 29, 2014
Sold by
Ohara Patrick
Bought by
Royal Savings Bank
Purchase Details
Closed on
Aug 16, 2005
Sold by
Manson Claude J and Manson Denise D
Bought by
Ohara Patrick
Home Financials for this Owner
Home Financials are based on the most recent Mortgage that was taken out on this home.
Original Mortgage
$155,000
Interest Rate
5.82%
Mortgage Type
Fannie Mae Freddie Mac
Create a Home Valuation Report for This Property
The Home Valuation Report is an in-depth analysis detailing your home's value as well as a comparison with similar homes in the area
Home Values in the Area
Average Home Value in this Area
Purchase History
| Date | Buyer | Sale Price | Title Company |
|---|---|---|---|
| Flores Edgar | $84,000 | First American Title | |
| Rivera Felipe A | $43,500 | Fidelity Natl Title Ins Co | |
| Royal Savings Bank | -- | Fidelity Natl Title Ins Co | |
| Ohara Patrick | $175,000 | Multiple |
Source: Public Records
Mortgage History
| Date | Status | Borrower | Loan Amount |
|---|---|---|---|
| Open | Flores Edgar | $79,800 | |
| Previous Owner | Ohara Patrick | $155,000 |
Source: Public Records
Tax History Compared to Growth
Tax History
| Year | Tax Paid | Tax Assessment Tax Assessment Total Assessment is a certain percentage of the fair market value that is determined by local assessors to be the total taxable value of land and additions on the property. | Land | Improvement |
|---|---|---|---|---|
| 2024 | $7,026 | $17,000 | $3,660 | $13,340 |
| 2023 | $5,991 | $17,000 | $3,660 | $13,340 |
| 2022 | $5,991 | $11,044 | $3,203 | $7,841 |
| 2021 | $6,073 | $11,043 | $3,202 | $7,841 |
| 2020 | $5,625 | $11,043 | $3,202 | $7,841 |
| 2019 | $6,729 | $13,002 | $2,973 | $10,029 |
| 2018 | $6,728 | $13,002 | $2,973 | $10,029 |
| 2017 | $6,459 | $13,002 | $2,973 | $10,029 |
| 2016 | $5,369 | $10,919 | $2,745 | $8,174 |
| 2015 | $5,322 | $10,919 | $2,745 | $8,174 |
| 2014 | $3,943 | $10,919 | $2,745 | $8,174 |
| 2013 | -- | $13,333 | $2,745 | $10,588 |
Source: Public Records
Map
Nearby Homes
- 3638 213th St
- 3533 212th Place
- 21209 Oak St
- 21142 Locust St
- 3711 213th Place
- 3712 214th St
- 3718 211th Place
- 3422 Station Dr
- 3727 214th Place Unit 2
- 549 Homan Ave
- 3704 215th St Unit 205
- 519 Chase St
- 305 Jackson St
- 242 Hickory St
- 3809 215th St
- 21607 Main St
- 508 Davis St
- 410 Gettysburg St
- 307 Gettysburg St
- 120 Indiana St
- 21232 Main St
- 3615 212th Place
- 21242 Main St
- 21242 Main St
- 21218 Main St
- 3610 212th Place
- 3619 212th Place
- 3614 212th Place
- 3551 212th Place
- 21231 Main St
- 3612 213th St
- 3606 213th St
- 21217 Locust St
- 21212 Main St
- 3618 213th St
- 3552 212th Place
- 21211 Locust St
- 3627 212th Place
- 3543 212th Place
- 21208 Main St