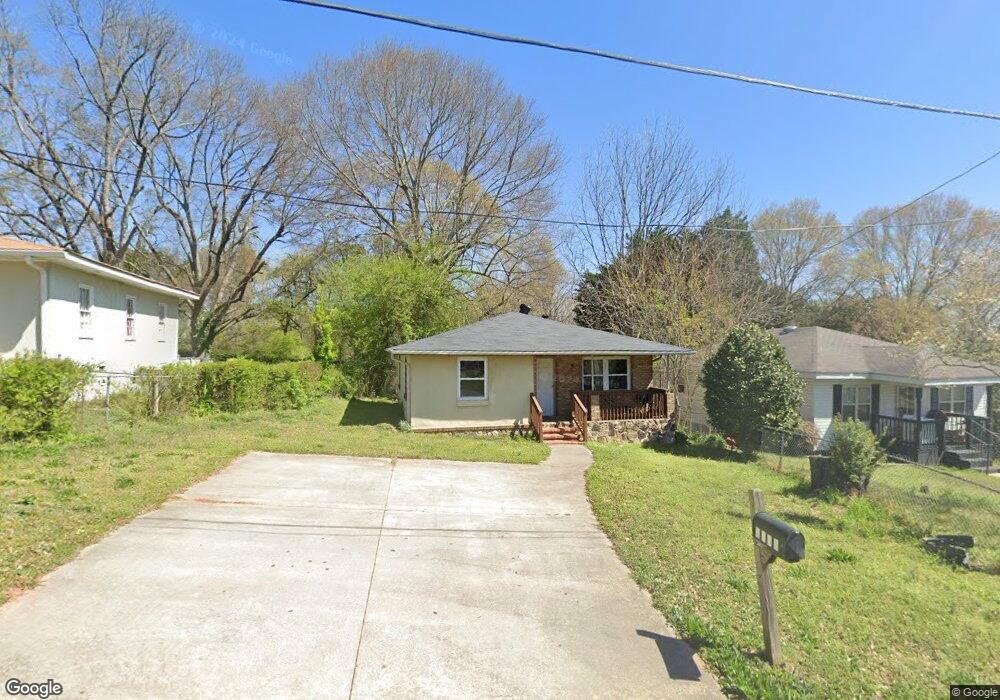
3611 E Bolding Rd Flowery Branch, GA 30542
Estimated Value: $180,775 - $208,000
2
Beds
1
Bath
776
Sq Ft
$245/Sq Ft
Est. Value
About This Home
This home is located at 3611 E Bolding Rd, Flowery Branch, GA 30542 and is currently estimated at $190,194, approximately $245 per square foot. 3611 E Bolding Rd is a home located in Hall County with nearby schools including Chicopee Elementary School, South Hall Middle School, and Johnson High School.
Ownership History
Date
Name
Owned For
Owner Type
Purchase Details
Closed on
May 31, 2019
Sold by
Magana Hermila
Bought by
Carrillo Juan Jaime
Current Estimated Value
Home Financials for this Owner
Home Financials are based on the most recent Mortgage that was taken out on this home.
Original Mortgage
$64,875
Outstanding Balance
$41,535
Interest Rate
4.1%
Mortgage Type
New Conventional
Estimated Equity
$148,659
Purchase Details
Closed on
Jul 28, 2005
Sold by
Magana Hermila
Bought by
Magana Hermilae and Magana Fernando
Purchase Details
Closed on
Nov 4, 2003
Sold by
Gulachek Carol
Bought by
Countrywide Home Loans Inc
Purchase Details
Closed on
Apr 5, 2002
Sold by
Entrekin J W
Bought by
Gulachek Carol
Home Financials for this Owner
Home Financials are based on the most recent Mortgage that was taken out on this home.
Original Mortgage
$51,000
Interest Rate
6.89%
Mortgage Type
New Conventional
Create a Home Valuation Report for This Property
The Home Valuation Report is an in-depth analysis detailing your home's value as well as a comparison with similar homes in the area
Home Values in the Area
Average Home Value in this Area
Purchase History
| Date | Buyer | Sale Price | Title Company |
|---|---|---|---|
| Carrillo Juan Jaime | $86,500 | -- | |
| Magana Hermilae | -- | -- | |
| Countrywide Home Loans Inc | -- | -- | |
| Gulachek Carol | $51,000 | -- |
Source: Public Records
Mortgage History
| Date | Status | Borrower | Loan Amount |
|---|---|---|---|
| Open | Carrillo Juan Jaime | $64,875 | |
| Previous Owner | Gulachek Carol | $51,000 |
Source: Public Records
Tax History Compared to Growth
Tax History
| Year | Tax Paid | Tax Assessment Tax Assessment Total Assessment is a certain percentage of the fair market value that is determined by local assessors to be the total taxable value of land and additions on the property. | Land | Improvement |
|---|---|---|---|---|
| 2024 | $1,514 | $58,320 | $4,480 | $53,840 |
| 2023 | $1,560 | $60,200 | $4,480 | $55,720 |
| 2022 | $1,242 | $45,360 | $4,480 | $40,880 |
| 2021 | $1,057 | $37,480 | $2,680 | $34,800 |
| 2020 | $1,009 | $38,400 | $3,600 | $34,800 |
| 2019 | $329 | $9,334 | $3,600 | $5,734 |
| 2018 | $295 | $7,822 | $2,520 | $5,302 |
| 2017 | $293 | $7,822 | $2,520 | $5,302 |
| 2016 | $287 | $7,822 | $2,520 | $5,302 |
| 2015 | $289 | $7,822 | $2,520 | $5,302 |
| 2014 | $289 | $7,822 | $2,520 | $5,302 |
Source: Public Records
Map
Nearby Homes
- 3615 E Bolding Rd
- 3605 E Bolding Rd
- 3538 Browning Dr
- 3548 Browning Dr
- 3536 Browning Dr
- 3534 Browning Dr
- 3612 E Bolding Rd
- 3619 E Bolding Rd
- 0 Browning Dr Unit 7032966
- 3515 Bolding Rd
- 3552 Browning Dr
- 3618 E Bolding Rd
- 3609 Bolding Rd
- 3535 Browning Dr
- 3526 Browning Dr
- 3509 Bolding Rd
- 3621 Bolding Rd
- 3554 Browning Dr
- 3623 E Bolding Rd
- 3539 Browning Dr