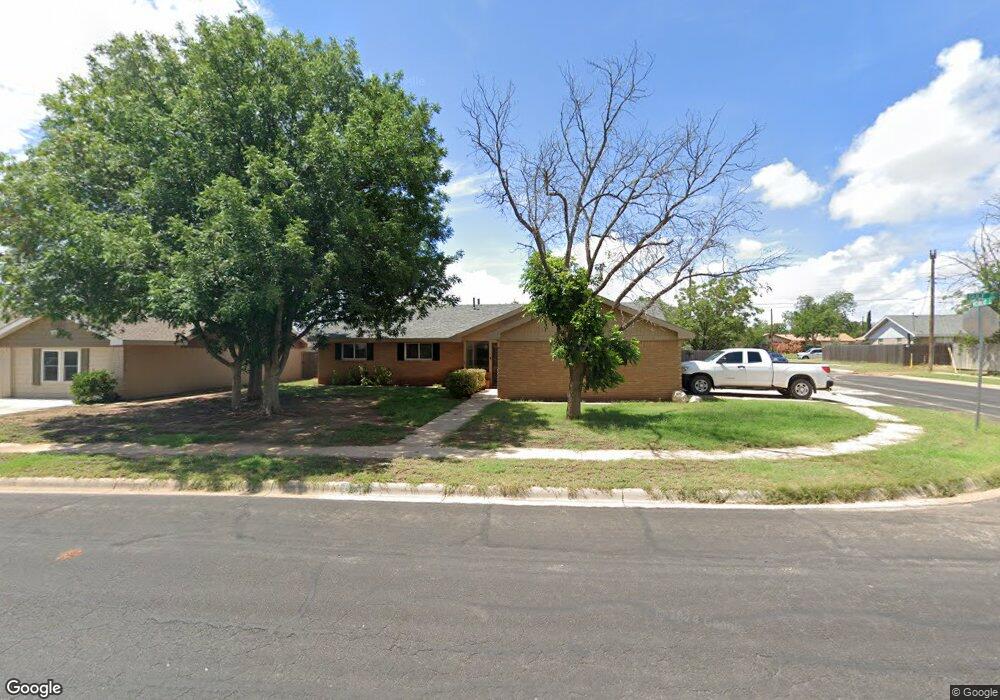
3611 Gulf Ave Midland, TX 79707
Wedgewood Park NeighborhoodEstimated Value: $278,000 - $296,000
--
Bed
--
Bath
1,681
Sq Ft
$171/Sq Ft
Est. Value
About This Home
This home is located at 3611 Gulf Ave, Midland, TX 79707 and is currently estimated at $286,870, approximately $170 per square foot. 3611 Gulf Ave is a home located in Midland County with nearby schools including Rusk Elementary School, Alamo Junior High School, and Trinity School of Midland.
Ownership History
Date
Name
Owned For
Owner Type
Purchase Details
Closed on
Oct 19, 2018
Sold by
Hobbs Terri Sue
Bought by
Davis David W
Current Estimated Value
Home Financials for this Owner
Home Financials are based on the most recent Mortgage that was taken out on this home.
Original Mortgage
$250,000
Outstanding Balance
$217,566
Interest Rate
4.5%
Mortgage Type
VA
Estimated Equity
$69,304
Purchase Details
Closed on
Mar 28, 2018
Sold by
U S Bank National Association
Bought by
Hobbs Terri Sue
Purchase Details
Closed on
Jan 4, 2018
Sold by
Turner Bruce Clay
Bought by
Mortgage Equity Conversion Asset Trust and Mortgage Backed Securities
Purchase Details
Closed on
Oct 2, 2015
Sold by
Turner Ialee Kay
Bought by
Turner Bruce Clay and Turner Ialee Kay
Purchase Details
Closed on
Jun 21, 1960
Bought by
Turner Walter L
Create a Home Valuation Report for This Property
The Home Valuation Report is an in-depth analysis detailing your home's value as well as a comparison with similar homes in the area
Home Values in the Area
Average Home Value in this Area
Purchase History
| Date | Buyer | Sale Price | Title Company |
|---|---|---|---|
| Davis David W | -- | Permian Abstract Company | |
| Hobbs Terri Sue | -- | None Available | |
| Mortgage Equity Conversion Asset Trust | -- | Old Republic Servicing | |
| Turner Bruce Clay | -- | None Available | |
| Turner Walter L | -- | -- |
Source: Public Records
Mortgage History
| Date | Status | Borrower | Loan Amount |
|---|---|---|---|
| Open | Davis David W | $250,000 |
Source: Public Records
Tax History Compared to Growth
Tax History
| Year | Tax Paid | Tax Assessment Tax Assessment Total Assessment is a certain percentage of the fair market value that is determined by local assessors to be the total taxable value of land and additions on the property. | Land | Improvement |
|---|---|---|---|---|
| 2025 | $2,643 | $246,520 | $18,000 | $228,520 |
| 2024 | $2,648 | $252,380 | $18,000 | $234,380 |
| 2023 | $2,600 | $252,380 | $18,000 | $234,380 |
| 2022 | $4,078 | $260,980 | $18,000 | $242,980 |
| 2021 | $4,547 | $260,980 | $18,000 | $242,980 |
| 2020 | $3,568 | $244,410 | $18,000 | $226,410 |
| 2019 | $4,627 | $244,410 | $18,000 | $226,410 |
| 2018 | $3,122 | $160,580 | $18,000 | $142,580 |
| 2017 | $3,036 | $156,140 | $18,000 | $138,140 |
| 2016 | $2,800 | $151,770 | $18,000 | $133,770 |
| 2015 | -- | $151,770 | $18,000 | $133,770 |
| 2014 | -- | $147,290 | $18,000 | $129,290 |
Source: Public Records
Map
Nearby Homes
- 2000 Freeport Ln
- 3517 Seaboard Ave
- 3523 Lonoke Ave
- 4313 W Dengar Ave
- 1824 Northern Ln
- 1818 Northern Ln
- 3802 Suncrest Ave
- 1509 Cascade Ct
- 2906 Aurora Ln
- 1502 Alcove Ct
- 2106 Rosita Dr
- 4342 W Dengar Ave
- 3200 Highsky Dr
- 3311 Terrace Ave
- 3316 W Dengar Ave
- 3204 Shell Ave
- 3619 W Wadley Ave
- 4206 Nelson Rd
- 4310 Nelson Rd
- 3213 Shell Ave
- 3609 Gulf Ave
- 3612 Humble Ave
- 3701 Gulf Ave
- 3610 Humble Ave
- 3607 Gulf Ave
- 3608 Gulf Ave
- 3700 Humble Ave
- 3610 Gulf Ave
- 3608 Humble Ave
- 3606 Gulf Ave
- 3612 Gulf Ave
- 3703 Gulf Ave
- 3702 Humble Ave
- 3605 Gulf Ave
- 3606 Humble Ave
- 3604 Gulf Ave
- 3614 Gulf Ave
- 3615 Humble Ave
- 3613 Humble Ave
- 3609 Stanolind Ave