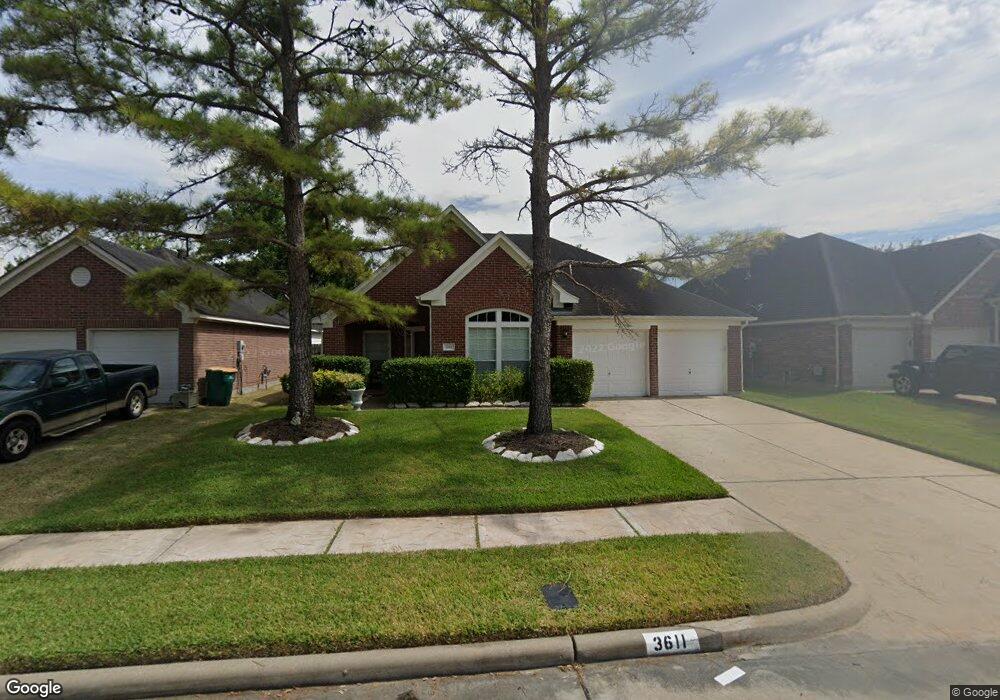
3611 Kennedy Dr Pearland, TX 77584
Silverlake NeighborhoodEstimated Value: $316,000 - $372,000
--
Bed
1
Bath
2,093
Sq Ft
$161/Sq Ft
Est. Value
About This Home
This home is located at 3611 Kennedy Dr, Pearland, TX 77584 and is currently estimated at $336,570, approximately $160 per square foot. 3611 Kennedy Dr is a home located in Brazoria County with nearby schools including Massey Ranch Elementary School, Pearland Junior High School South, and Sam Jamison Middle School.
Ownership History
Date
Name
Owned For
Owner Type
Purchase Details
Closed on
Sep 25, 2001
Sold by
Simpson Cody R and Simpson Tamara D
Bought by
Americorp Inc
Current Estimated Value
Home Financials for this Owner
Home Financials are based on the most recent Mortgage that was taken out on this home.
Original Mortgage
$15,490
Interest Rate
6.77%
Mortgage Type
Purchase Money Mortgage
Purchase Details
Closed on
Jun 6, 2001
Sold by
Americorp Inc
Bought by
Nguyen Van Mai
Home Financials for this Owner
Home Financials are based on the most recent Mortgage that was taken out on this home.
Original Mortgage
$123,920
Interest Rate
6.77%
Purchase Details
Closed on
Sep 20, 1999
Sold by
Perry Homes
Bought by
Simpson Cody R
Home Financials for this Owner
Home Financials are based on the most recent Mortgage that was taken out on this home.
Original Mortgage
$134,450
Interest Rate
8.02%
Create a Home Valuation Report for This Property
The Home Valuation Report is an in-depth analysis detailing your home's value as well as a comparison with similar homes in the area
Home Values in the Area
Average Home Value in this Area
Purchase History
| Date | Buyer | Sale Price | Title Company |
|---|---|---|---|
| Americorp Inc | -- | Alamo Title Company | |
| Nguyen Van Mai | -- | Alamo Title Company | |
| Simpson Cody R | -- | Chicago Title |
Source: Public Records
Mortgage History
| Date | Status | Borrower | Loan Amount |
|---|---|---|---|
| Closed | Americorp Inc | $15,490 | |
| Previous Owner | Nguyen Van Mai | $123,920 | |
| Previous Owner | Simpson Cody R | $134,450 |
Source: Public Records
Tax History Compared to Growth
Tax History
| Year | Tax Paid | Tax Assessment Tax Assessment Total Assessment is a certain percentage of the fair market value that is determined by local assessors to be the total taxable value of land and additions on the property. | Land | Improvement |
|---|---|---|---|---|
| 2025 | $3,778 | $313,330 | $61,740 | $251,590 |
| 2023 | $3,778 | $301,653 | $58,800 | $242,890 |
| 2022 | $6,104 | $274,230 | $31,340 | $242,890 |
| 2021 | $6,410 | $251,700 | $31,340 | $220,360 |
| 2020 | $6,011 | $236,000 | $24,110 | $211,890 |
| 2019 | $5,545 | $214,950 | $24,110 | $190,840 |
| 2018 | $5,571 | $214,950 | $24,110 | $190,840 |
| 2017 | $5,524 | $214,950 | $24,110 | $190,840 |
| 2016 | $5,022 | $211,900 | $24,110 | $187,790 |
| 2015 | $3,971 | $174,980 | $24,110 | $150,870 |
| 2014 | $3,971 | $162,890 | $24,110 | $138,780 |
Source: Public Records
Map
Nearby Homes
- 3739 Crescent Dr
- 3731 Crescent Dr
- 3722 Paigewood Dr
- 3615 Rivers Rd
- 3602 Chesapeake Ct
- 3310 E Overdale Dr
- 4531 Curry St
- 3606 Miraglen Dr
- 0 Bailey Rd Unit 89982715
- 0 Bailey Rd
- 3606 Kilgore Ct
- 3131 Valley Ct
- 00 Bailey Rd
- 4146 S Webber Dr
- 3103 Valley Ct
- 3143 Edgewood Dr
- 2923 Elsbury Ln
- 3511 Old Massey Ranch Rd
- 3307 Lawson Dr
- 3707 Pecan Ct
- 3615 Kennedy Dr
- 3615 Kennedy Dr
- 3619 Kennedy Dr
- 3603 Kennedy Dr
- 3630 Deerbrook Ct
- 3626 Deerbrook Ct
- 3831 Glenhill Dr
- 3606 Kennedy Dr
- 3623 Kennedy Dr
- 3531 Kennedy Dr
- 3602 Kennedy Dr
- 3627 Kennedy Dr
- 3527 Kennedy Dr
- 3823 Glenhill Dr
- 3622 Deerbrook Ct
- 3830 Glenhill Dr
- 3530 Kennedy Dr
- 3631 Deerbrook Ct
- 3623 Englewood Dr
- 3826 Glenhill Dr