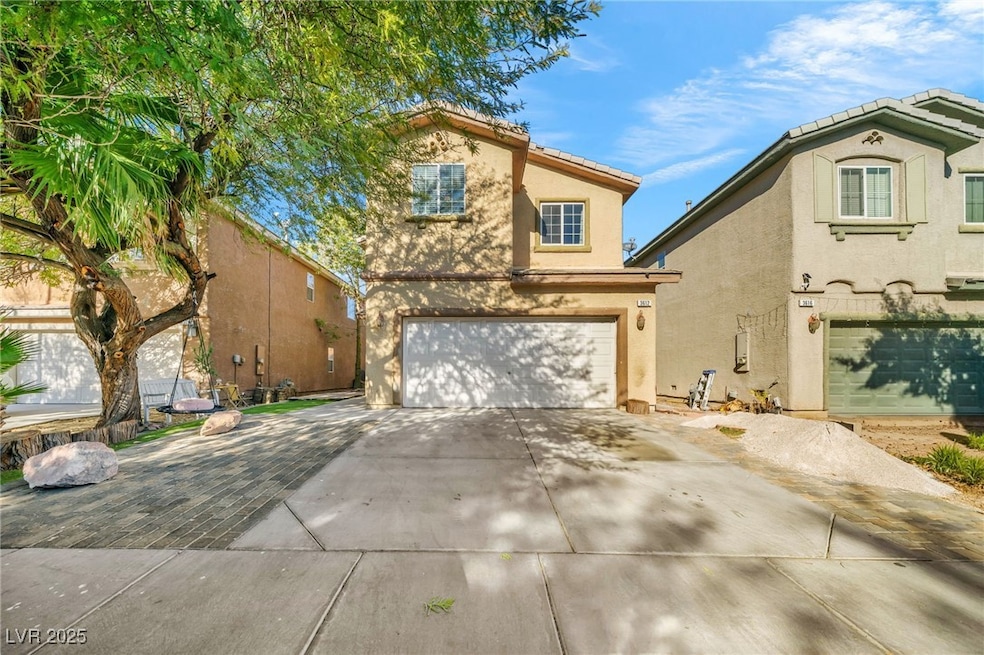
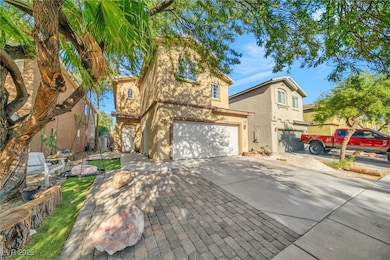
3612 Asbury Hill Ave Las Vegas, NV 89110
East Las Vegas NeighborhoodEstimated payment $2,346/month
Highlights
- No HOA
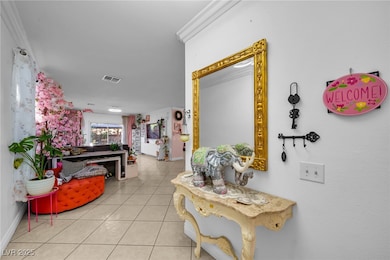
- Ceramic Tile Flooring
- South Facing Home
- 2 Car Attached Garage
- Central Heating and Cooling System
About This Home
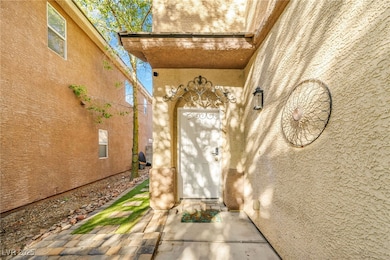
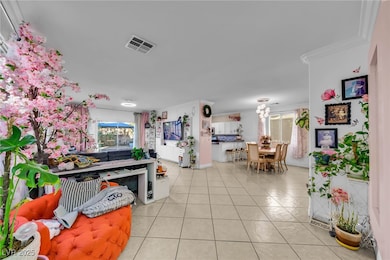
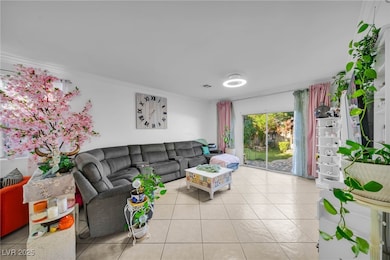
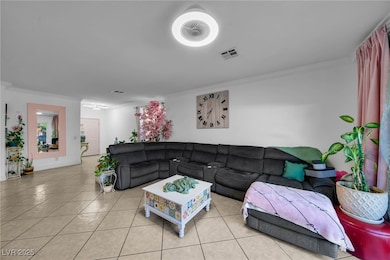
Beautiful 3-bedroom, 3-bath home featuring a spacious loft upstairs, perfect for a second living area, office, or playroom. The backyard offers low-maintenance synthetic grass and a charming gazebo, creating the perfect outdoor retreat. Inside, the home is clean, well-kept, and truly move-in ready. All appliances are included, making your transition effortless. Don’t miss this wonderful property with great space, comfort, and a welcoming layout
Listing Agent
Rossum Realty Unlimited Brokerage Phone: 702-368-1850 License #S.0176017 Listed on: 12/09/2025
Home Details
Home Type
- Single Family
Est. Annual Taxes
- $1,957
Year Built
- Built in 2007
Lot Details
- 3,920 Sq Ft Lot
- South Facing Home
- Back Yard Fenced
- Brick Fence
Parking
- 2 Car Attached Garage
Home Design
- Tile Roof
Interior Spaces
- 2,098 Sq Ft Home
- 2-Story Property
Kitchen
- Gas Range
- Microwave
- Disposal
Flooring
- Laminate
- Ceramic Tile
Bedrooms and Bathrooms
- 3 Bedrooms
Laundry
- Laundry on upper level
- Dryer
- Washer
Schools
- Gragson Elementary School
- Martin Roy Middle School
- Desert Pines High School
Utilities
- Central Heating and Cooling System
- Heating System Uses Gas
- Underground Utilities
Community Details
- No Home Owners Association
- Valencia Terrace Subdivision
Map
Home Values in the Area
Average Home Value in this Area
Tax History
| Year | Tax Paid | Tax Assessment Tax Assessment Total Assessment is a certain percentage of the fair market value that is determined by local assessors to be the total taxable value of land and additions on the property. | Land | Improvement |
|---|---|---|---|---|
| 2025 | $1,866 | $108,668 | $24,850 | $83,818 |
| 2024 | $1,812 | $108,668 | $24,850 | $83,818 |
| 2023 | $1,812 | $104,746 | $25,900 | $78,846 |
| 2022 | $1,678 | $94,518 | $22,750 | $71,768 |
| 2021 | $1,554 | $83,656 | $20,300 | $63,356 |
| 2020 | $1,440 | $84,968 | $17,500 | $67,468 |
| 2019 | $1,350 | $78,049 | $15,750 | $62,299 |
| 2018 | $1,288 | $64,677 | $12,250 | $52,427 |
| 2017 | $2,437 | $74,332 | $10,500 | $63,832 |
| 2016 | $1,458 | $53,370 | $7,000 | $46,370 |
| 2015 | $1,451 | $50,592 | $5,600 | $44,992 |
| 2014 | $1,166 | $37,876 | $4,200 | $33,676 |
Property History
| Date | Event | Price | List to Sale | Price per Sq Ft |
|---|---|---|---|---|
| 12/09/2025 12/09/25 | For Sale | $415,000 | -- | $198 / Sq Ft |
Purchase History
| Date | Type | Sale Price | Title Company |
|---|---|---|---|
| Quit Claim Deed | -- | None Listed On Document | |
| Bargain Sale Deed | -- | None Listed On Document | |
| Bargain Sale Deed | -- | None Listed On Document | |
| Bargain Sale Deed | $125,000 | Netco | |
| Quit Claim Deed | $1,316,063 | Netco | |
| Quit Claim Deed | $1,341,063 | First American Title Howard | |
| Trustee Deed | $1,002,971 | Fidelity National Title Las |
Source: Las Vegas REALTORS®
MLS Number: 2740558
APN: 140-31-122-003
Disclaimer: Certain information contained herein is derived from information provided by parties other than Homes.com. All information provided is deemed reliable, but is not guaranteed to be accurate and should be independently verified.
![]() The data relating to real estate for sale on this web site comes in part from the INTERNET DATA EXCHANGE Program of the Greater Las Vegas Association of REALTORS® MLS. Real estate listings held by brokerage firms other than this site owner are marked with the IDX logo. Information is deemed reliable but not guaranteed. Copyright 2025 of the Greater Las Vegas Association of REALTORS® MLS. All rights reserved.
The data relating to real estate for sale on this web site comes in part from the INTERNET DATA EXCHANGE Program of the Greater Las Vegas Association of REALTORS® MLS. Real estate listings held by brokerage firms other than this site owner are marked with the IDX logo. Information is deemed reliable but not guaranteed. Copyright 2025 of the Greater Las Vegas Association of REALTORS® MLS. All rights reserved.
- 3675 Asbury Hill Ave
- 592 Sea Shell Ln
- 3700 Stewart Ave Unit 132
- 3700 Stewart Ave Unit 183
- 3700 Stewart Ave Unit 235
- 432 Anchor St
- 3908 Montebello Ave
- 3933 Herford Ln Unit 1
- 833 Hedge Way Unit 2
- 3620 Park Oliver Dr
- 848 Hedge Way Unit 3
- 1405 N Sandhill Rd Unit 2
- 951 N Sandhill Rd
- 3933 Harris Ave
- 4028 Red Pony Ct
- 4028 Lighthouse Ave
- 868 Parkhurst St Unit 1
- 2915 Cedar Ave Unit 11C
- 4013 Alameda Ave
- 3982 Saguaro Ln
- 3700 E Bonanza Rd
- 3700 Stewart Ave Unit 235
- 3700 Stewart Ave Unit 183
- 3601 Folage Dr Unit 1
- 3909 Montebello Ave
- 4000 E Bonanza Rd
- 2933 Elm Ave Unit 4
- 2929 Elm Ave
- 506 Wardelle St Unit C
- 401 N 28th St
- 60 N Pecos Rd
- 453 N Lamb Blvd Unit G
- 25 Gold Bar Ct Unit C
- 2608 E Mesquite Ave Unit 3
- 2513 Cedar Ave Unit 1
- 2513 Cedar Ave Unit 3
- 522 N Lamb Blvd
- 2504 E Mesquite Ave Unit 4
- 2505 Cedar Ave Unit 3
- 1404 Henry Dr Unit A
