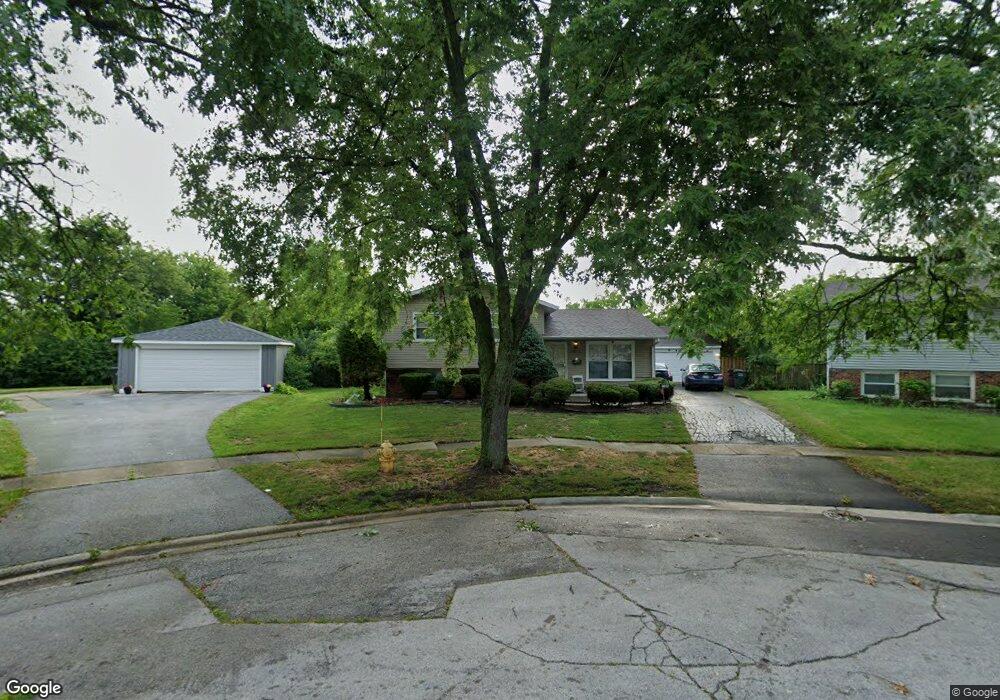
3612 Coventry Ct Hazel Crest, IL 60429
Estimated Value: $179,000 - $249,000
3
Beds
2
Baths
1,066
Sq Ft
$201/Sq Ft
Est. Value
About This Home
This home is located at 3612 Coventry Ct, Hazel Crest, IL 60429 and is currently estimated at $213,914, approximately $200 per square foot. 3612 Coventry Ct is a home located in Cook County with nearby schools including Highlands Elementary School, Prairie-Hills Junior High School, and Hillcrest High School.
Ownership History
Date
Name
Owned For
Owner Type
Purchase Details
Closed on
Jun 26, 2008
Sold by
Lewis Jennifer R and Mcgee Dwayne
Bought by
Butler Rainnese C
Current Estimated Value
Home Financials for this Owner
Home Financials are based on the most recent Mortgage that was taken out on this home.
Original Mortgage
$106,118
Outstanding Balance
$68,390
Interest Rate
6.05%
Mortgage Type
FHA
Estimated Equity
$145,524
Purchase Details
Closed on
Sep 9, 2003
Sold by
Phoenix Bond & Indemnity Co
Bought by
Chaison Jennifer
Home Financials for this Owner
Home Financials are based on the most recent Mortgage that was taken out on this home.
Original Mortgage
$96,800
Interest Rate
5.87%
Mortgage Type
New Conventional
Purchase Details
Closed on
Apr 17, 2002
Sold by
Orr David D
Bought by
Phoenix Bond & Indemnity Company
Purchase Details
Closed on
Mar 17, 1995
Sold by
Williams Elaine T
Bought by
Williams Derrick I
Create a Home Valuation Report for This Property
The Home Valuation Report is an in-depth analysis detailing your home's value as well as a comparison with similar homes in the area
Home Values in the Area
Average Home Value in this Area
Purchase History
| Date | Buyer | Sale Price | Title Company |
|---|---|---|---|
| Butler Rainnese C | $150,000 | Multiple | |
| Chaison Jennifer | $121,000 | Ticor Title Insurance | |
| Phoenix Bond & Indemnity Company | -- | -- | |
| Williams Derrick I | -- | -- |
Source: Public Records
Mortgage History
| Date | Status | Borrower | Loan Amount |
|---|---|---|---|
| Open | Butler Rainnese C | $106,118 | |
| Previous Owner | Chaison Jennifer | $96,800 | |
| Closed | Chaison Jennifer | $24,200 |
Source: Public Records
Tax History Compared to Growth
Tax History
| Year | Tax Paid | Tax Assessment Tax Assessment Total Assessment is a certain percentage of the fair market value that is determined by local assessors to be the total taxable value of land and additions on the property. | Land | Improvement |
|---|---|---|---|---|
| 2024 | $6,498 | $16,000 | $3,400 | $12,600 |
| 2023 | $5,628 | $16,000 | $3,400 | $12,600 |
| 2022 | $5,628 | $11,087 | $2,914 | $8,173 |
| 2021 | $5,488 | $11,086 | $2,913 | $8,173 |
| 2020 | $5,363 | $11,086 | $2,913 | $8,173 |
| 2019 | $3,125 | $8,096 | $2,671 | $5,425 |
| 2018 | $3,024 | $8,096 | $2,671 | $5,425 |
| 2017 | $2,862 | $8,096 | $2,671 | $5,425 |
| 2016 | $3,587 | $8,633 | $2,428 | $6,205 |
| 2015 | $3,366 | $8,633 | $2,428 | $6,205 |
| 2014 | $2,311 | $8,633 | $2,428 | $6,205 |
| 2013 | $2,880 | $8,643 | $2,428 | $6,215 |
Source: Public Records
Map
Nearby Homes
- 17303 Appletree Dr
- 3617 175th Place
- 17316 Central Park Ave
- 17640 Central Park Ave
- 17651 Hillcrest Dr
- 3618 Peach Grove Ln
- 3512 Woodworth Place
- 17511 Winston Dr Unit 1
- 17617 Central Park Ave
- 3651 177th St
- 3740 Highland Place
- 3806 172nd St
- 7R3 Country Club Ln
- 7R2 Country Club Ln
- 17721 Sarah Ln
- 17206 Elm Dr
- 17710 Harvard Ln
- 3500 Maple Ln
- 3800 171st St
- 17700 Springfield Ave
- 3614 Coventry Ct
- 3613 Coventry Ct
- 3615 Wheelwood Ct
- 3615 Coventry Ct
- 3613 Wheelwood Ct
- 3617 Wheelwood Ct
- 3616 Coventry Ct
- 3617 Coventry Ct
- 3614 Wellington Ct
- 3612 Wellington Ct
- 3619 Wheelwood Ct
- 3610 Wellington Ct
- 3612 Wheelwood Ct
- 3608 Wellington Ct
- 17402 Appletree Dr
- 17404 Appletree Dr
- 3606 Wellington Ct
- 3614 Wheelwood Ct
- 3616 Wheelwood Ct
- 3618 Wheelwood Ct