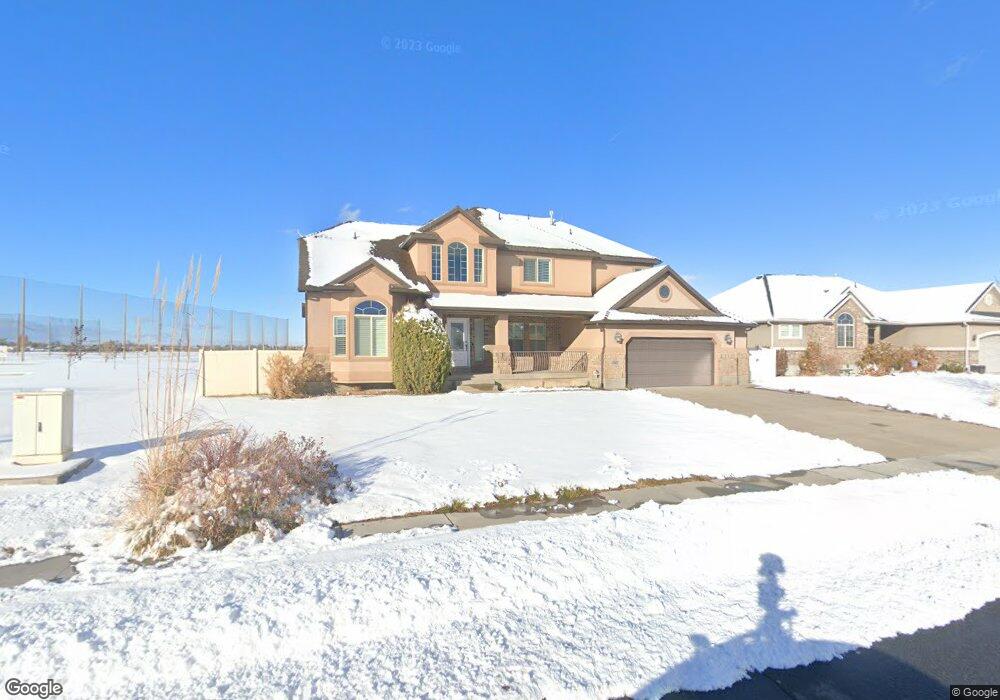
3612 Cranefield Rd Clearfield, UT 84015
Estimated Value: $733,000 - $839,000
5
Beds
4
Baths
3,134
Sq Ft
$252/Sq Ft
Est. Value
About This Home
This home is located at 3612 Cranefield Rd, Clearfield, UT 84015 and is currently estimated at $791,301, approximately $252 per square foot. 3612 Cranefield Rd is a home located in Davis County with nearby schools including West Point School, West Point Junior High School, and Clearfield High School.
Ownership History
Date
Name
Owned For
Owner Type
Purchase Details
Closed on
May 4, 2012
Sold by
Beavers Mark A and Beavers Janice F
Bought by
Beavers Mark A and Beavers Janice E
Current Estimated Value
Home Financials for this Owner
Home Financials are based on the most recent Mortgage that was taken out on this home.
Original Mortgage
$416,998
Outstanding Balance
$285,334
Interest Rate
3.94%
Mortgage Type
VA
Estimated Equity
$505,967
Purchase Details
Closed on
Apr 20, 2009
Sold by
Ivory Homes Ltd
Bought by
Beavers Mark A and Beavers Janice E
Home Financials for this Owner
Home Financials are based on the most recent Mortgage that was taken out on this home.
Original Mortgage
$417,000
Interest Rate
5.17%
Mortgage Type
VA
Create a Home Valuation Report for This Property
The Home Valuation Report is an in-depth analysis detailing your home's value as well as a comparison with similar homes in the area
Home Values in the Area
Average Home Value in this Area
Purchase History
| Date | Buyer | Sale Price | Title Company |
|---|---|---|---|
| Beavers Mark A | -- | Meridin Title Company | |
| Beavers Mark A | -- | Cottonwood Title Ins Agency | |
| Ivory Homes Ltd | -- | Cottonwood Title Ins Agency |
Source: Public Records
Mortgage History
| Date | Status | Borrower | Loan Amount |
|---|---|---|---|
| Open | Beavers Mark A | $416,998 | |
| Closed | Beavers Mark A | $417,000 |
Source: Public Records
Tax History
| Year | Tax Paid | Tax Assessment Tax Assessment Total Assessment is a certain percentage of the fair market value that is determined by local assessors to be the total taxable value of land and additions on the property. | Land | Improvement |
|---|---|---|---|---|
| 2025 | $1,641 | $418,550 | $93,812 | $324,738 |
| 2024 | $1,448 | $392,700 | $102,757 | $289,943 |
| 2023 | $1,387 | $684,000 | $117,547 | $566,453 |
| 2022 | $2,618 | $400,950 | $71,130 | $329,820 |
| 2021 | $1,985 | $542,000 | $90,356 | $451,644 |
| 2020 | $1,535 | $470,000 | $77,478 | $392,522 |
| 2019 | $1,616 | $462,000 | $89,243 | $372,757 |
| 2018 | $1,470 | $432,000 | $75,210 | $356,790 |
| 2016 | $1,397 | $219,890 | $29,433 | $190,457 |
| 2015 | $3,332 | $228,030 | $29,433 | $198,597 |
| 2014 | $1,387 | $213,227 | $29,433 | $183,794 |
| 2013 | -- | $207,820 | $31,020 | $176,800 |
Source: Public Records
Map
Nearby Homes
- 2444 N Hooded Crane Cir Unit 11
- 2000 Garden Plan at Cranefield Estates - Collection
- 2500 Farmhouse Plan at Cranefield Estates - Collection
- 1700 Farmhouse Plan at Cranefield Estates - Collection
- 3000 Traditional Plan at Cranefield Estates - Collection
- San Marino Traditional Plan at Cranefield Estates
- 3826 W 2350 N
- 3816 W 2300 N
- 2542 N 3300 W
- 2118 Snowy Crane Dr
- 3298 W 2300 N
- 339 N 3250 W Unit 12
- 3033 W 2600 N
- 3027 W 2600 N
- 3186 W 2600 N
- 3016 W 2650 N
- 3656 W 1800 N
- 4276 W 6025 S
- 6052 S 4275 W
- 2927 W 2100 N
- 3594 W Cranefield Rd
- 2283 Cranefield Rd
- 3612 W Cranefield Rd
- 3619 Cranefield Rd
- 3576 W Cranefield Rd
- 2458 Grey Crown Crane Dr W
- 3591 W 2560 N
- 3573 W Cranefield Rd
- 3568 W Cranefield Rd
- 3619 W Cranefield Rd
- 3559 W Cranefield Rd
- 2435 Grey Crown Crane Dr W
- 3637 Cranefield Rd
- 3584 W Grey Crown Crane Ln
- 3637 W Cranefield Rd
- 2438 Grey Crown Crane Dr W
- 3584 W 2420 N
- 3552 W Cranefield Rd
- 3576 W Grey Crown Crane Ln
- 2408 Grey Crown Crane Dr W