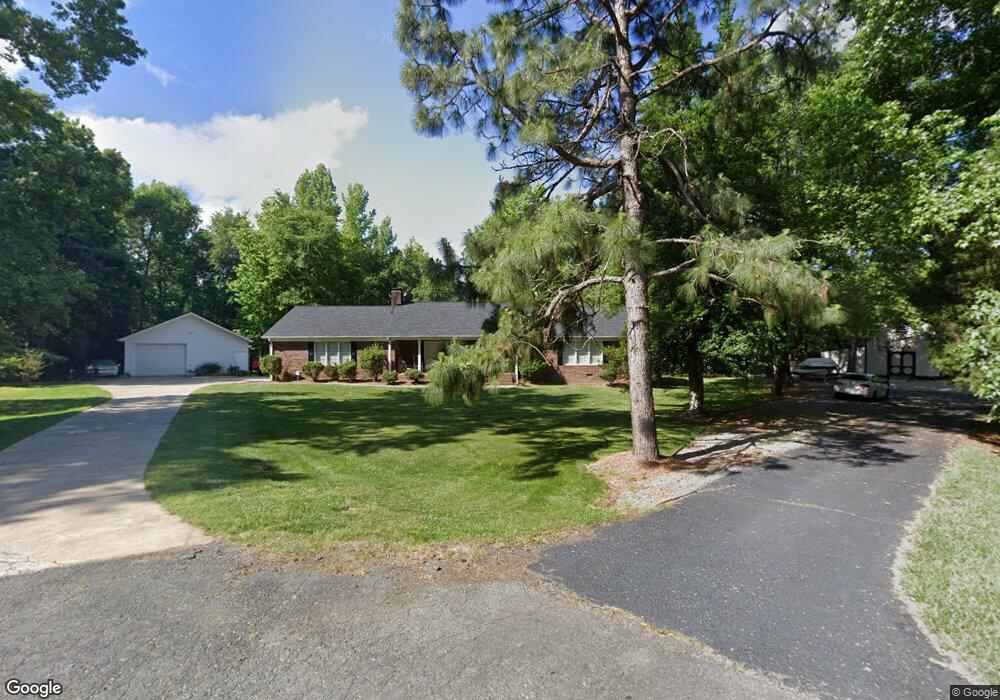
3612 Dakeita Cir Concord, NC 28025
Estimated Value: $411,000 - $548,000
3
Beds
3
Baths
2,090
Sq Ft
$223/Sq Ft
Est. Value
About This Home
This home is located at 3612 Dakeita Cir, Concord, NC 28025 and is currently estimated at $466,379, approximately $223 per square foot. 3612 Dakeita Cir is a home located in Cabarrus County with nearby schools including Bethel Elementary School, C.C. Griffin Middle School, and Central Cabarrus High School.
Ownership History
Date
Name
Owned For
Owner Type
Purchase Details
Closed on
May 16, 2005
Sold by
Myers Tracy Dale and Myers Stephanie
Bought by
Miller Jerry and Miller Patricia L
Current Estimated Value
Home Financials for this Owner
Home Financials are based on the most recent Mortgage that was taken out on this home.
Original Mortgage
$138,000
Outstanding Balance
$72,600
Interest Rate
5.98%
Mortgage Type
Fannie Mae Freddie Mac
Estimated Equity
$393,779
Purchase Details
Closed on
Nov 12, 2002
Sold by
Proper Cynthia L and Proper Gregory E
Bought by
Myers Tracy Dale and Myers Stephanie
Home Financials for this Owner
Home Financials are based on the most recent Mortgage that was taken out on this home.
Original Mortgage
$150,450
Interest Rate
5.98%
Purchase Details
Closed on
Apr 16, 1998
Sold by
Lynn Kendall Elbe and Joyce Carolyn
Bought by
Kendall Carolyn Joyce
Purchase Details
Closed on
Aug 1, 1979
Create a Home Valuation Report for This Property
The Home Valuation Report is an in-depth analysis detailing your home's value as well as a comparison with similar homes in the area
Home Values in the Area
Average Home Value in this Area
Purchase History
| Date | Buyer | Sale Price | Title Company |
|---|---|---|---|
| Miller Jerry | $203,000 | -- | |
| Myers Tracy Dale | $177,000 | -- | |
| Kendall Carolyn Joyce | -- | -- | |
| -- | $75,000 | -- |
Source: Public Records
Mortgage History
| Date | Status | Borrower | Loan Amount |
|---|---|---|---|
| Open | Miller Jerry | $138,000 | |
| Previous Owner | Myers Tracy Dale | $150,450 |
Source: Public Records
Tax History Compared to Growth
Tax History
| Year | Tax Paid | Tax Assessment Tax Assessment Total Assessment is a certain percentage of the fair market value that is determined by local assessors to be the total taxable value of land and additions on the property. | Land | Improvement |
|---|---|---|---|---|
| 2025 | $2,485 | $367,590 | $87,000 | $280,590 |
| 2024 | $2,485 | $367,590 | $87,000 | $280,590 |
| 2023 | $2,045 | $243,450 | $40,000 | $203,450 |
| 2022 | $2,045 | $243,450 | $40,000 | $203,450 |
| 2021 | $1,972 | $243,450 | $40,000 | $203,450 |
| 2020 | $1,972 | $243,450 | $40,000 | $203,450 |
| 2019 | $1,782 | $219,950 | $50,000 | $169,950 |
| 2018 | $1,716 | $219,950 | $50,000 | $169,950 |
| 2017 | $1,672 | $219,950 | $50,000 | $169,950 |
| 2016 | $1,650 | $218,950 | $60,000 | $158,950 |
| 2015 | $1,633 | $218,950 | $60,000 | $158,950 |
| 2014 | $1,633 | $218,950 | $60,000 | $158,950 |
Source: Public Records
Map
Nearby Homes
- 8629 Hayden Way
- 7787 Us Highway 601 S
- 3850 Willow Grove Ln Unit 24
- 10116 Robert Bost Rd
- 10483 Troutman Rd
- 10620 U S 601
- 10670 Troutman Rd
- 3400 Biggers Rd
- 3715 Vanderburg Dr
- 3500 Biggers Rd
- 10130 Reed Mine Rd
- 4207 Amanda Dr
- 11055 Graybark Rd
- 11060 Teresia Ln
- 2555 Biggers Rd
- 00 John Furr Rd Unit 3
- 5791 N Carolina 200
- 10791 Hartsell Rd
- 5625 Us Highway 601 S
- 6919 Clara Cir
- 3700 Dakeita Cir
- 3608 Dakeita Cir
- 3610 Baptist Ln
- 3613 Dakeita Cir
- 00. Hwy 601 Hwy
- 0 Hwy 601 None Unit 951812
- 00000 Hwy 601 None
- 0000 S Hwy 601 Hwy
- 3704 Dakeita Cir
- 4125 Dakeita Cir
- 3701 Dakeita Cir
- 3707 Dakeita Cir
- 4109 Dakeita Cir
- 4105 Dakeita Cir
- 4130 Dakeita Cir
- 3751 Dakeita Cir
- 4124 Dakeita Cir
- 3704 Baptist Ln
- 3550 Flowes Store Rd E
- 3800 Dakeita Cir