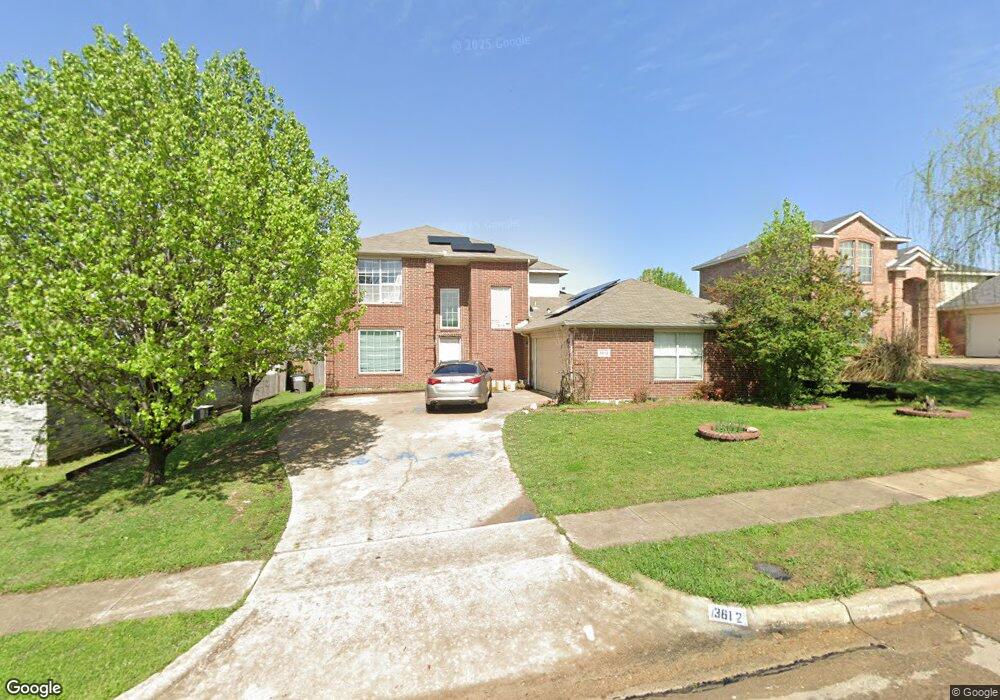
3612 Potomac Dr Sachse, TX 75048
Estimated Value: $410,000 - $484,000
4
Beds
3
Baths
2,727
Sq Ft
$164/Sq Ft
Est. Value
About This Home
This home is located at 3612 Potomac Dr, Sachse, TX 75048 and is currently estimated at $447,687, approximately $164 per square foot. 3612 Potomac Dr is a home located in Dallas County with nearby schools including Harmony Science Academy - Garland, Harmony School of Innovation - Garland, and Pinnacle Montessori of Sachse.
Ownership History
Date
Name
Owned For
Owner Type
Purchase Details
Closed on
Jul 24, 2012
Sold by
Gormsen Peter F and Gormsen Kelli
Bought by
Sannoh Mustapha and Sannoh Fanta
Current Estimated Value
Home Financials for this Owner
Home Financials are based on the most recent Mortgage that was taken out on this home.
Original Mortgage
$171,830
Outstanding Balance
$118,331
Interest Rate
3.62%
Mortgage Type
FHA
Estimated Equity
$329,356
Purchase Details
Closed on
Aug 27, 1999
Sold by
Choice Homes Inc
Bought by
Gormsen Peter F
Home Financials for this Owner
Home Financials are based on the most recent Mortgage that was taken out on this home.
Original Mortgage
$143,313
Interest Rate
7.58%
Mortgage Type
FHA
Purchase Details
Closed on
Mar 9, 1999
Sold by
Wilbow Miles Development Corp
Bought by
Choice Homes Texas Inc
Create a Home Valuation Report for This Property
The Home Valuation Report is an in-depth analysis detailing your home's value as well as a comparison with similar homes in the area
Home Values in the Area
Average Home Value in this Area
Purchase History
| Date | Buyer | Sale Price | Title Company |
|---|---|---|---|
| Sannoh Mustapha | -- | Nat | |
| Gormsen Peter F | -- | -- | |
| Choice Homes Texas Inc | -- | -- |
Source: Public Records
Mortgage History
| Date | Status | Borrower | Loan Amount |
|---|---|---|---|
| Open | Sannoh Mustapha | $171,830 | |
| Previous Owner | Gormsen Peter F | $143,313 |
Source: Public Records
Tax History Compared to Growth
Tax History
| Year | Tax Paid | Tax Assessment Tax Assessment Total Assessment is a certain percentage of the fair market value that is determined by local assessors to be the total taxable value of land and additions on the property. | Land | Improvement |
|---|---|---|---|---|
| 2025 | $9,414 | $441,500 | $80,000 | $361,500 |
| 2024 | $9,414 | $441,500 | $80,000 | $361,500 |
| 2023 | $9,414 | $410,770 | $80,000 | $330,770 |
| 2022 | $8,528 | $356,440 | $50,000 | $306,440 |
| 2021 | $7,467 | $290,150 | $45,000 | $245,150 |
| 2020 | $7,591 | $290,150 | $45,000 | $245,150 |
| 2019 | $7,385 | $260,350 | $40,000 | $220,350 |
| 2018 | $7,456 | $260,350 | $40,000 | $220,350 |
| 2017 | $6,826 | $237,680 | $40,000 | $197,680 |
| 2016 | $6,229 | $216,880 | $30,000 | $186,880 |
| 2015 | $4,255 | $210,270 | $30,000 | $180,270 |
| 2014 | $4,255 | $173,880 | $30,000 | $143,880 |
Source: Public Records
Map
Nearby Homes
- 3611 Valley Forge
- 3703 Stampede Dr
- 3302 Sewell Dr
- 4008 Leigh Ct
- 3553 Leigh Ct
- 3361 Leigh Ct
- 3901 Georgetown Dr
- 3417 Rosewood Ln
- 3476 Rosewood Ln
- 4415 Haverhill Ln
- 4005 Hawthorne Dr
- 3821 Red Oak St
- 4609 Hunters Ridge Dr
- 4406 Westcreek Ln
- 4516 Harvest Ln
- 2430 Pleasant Valley Rd
- 4612 Harvest Ln
- 3602 Pacific Way
- 3403 Scotsman Rd
- 3610 Pacific Way
- 3606 Potomac Dr
- 3616 Potomac Dr
- 3611 Valley Dr
- 3607 Valley Forge
- 3602 Potomac Dr
- 3702 Potomac Dr
- 3615 Valley Forge
- 3615 Valley Forge
- 3603 Valley Forge
- 3611 Potomac Dr
- 3615 Potomac Dr
- 3701 Potomac Dr
- 3514 Potomac Dr
- 3706 Potomac Dr
- 3703 Valley Forge
- 3515 Valley Forge
- 3601 Potomac Dr
- 3705 Potomac Dr
- 3510 Potomac Dr
- 3712 Potomac Dr