Estimated Value: $415,000 - $459,000
4
Beds
3
Baths
2,054
Sq Ft
$212/Sq Ft
Est. Value
About This Home
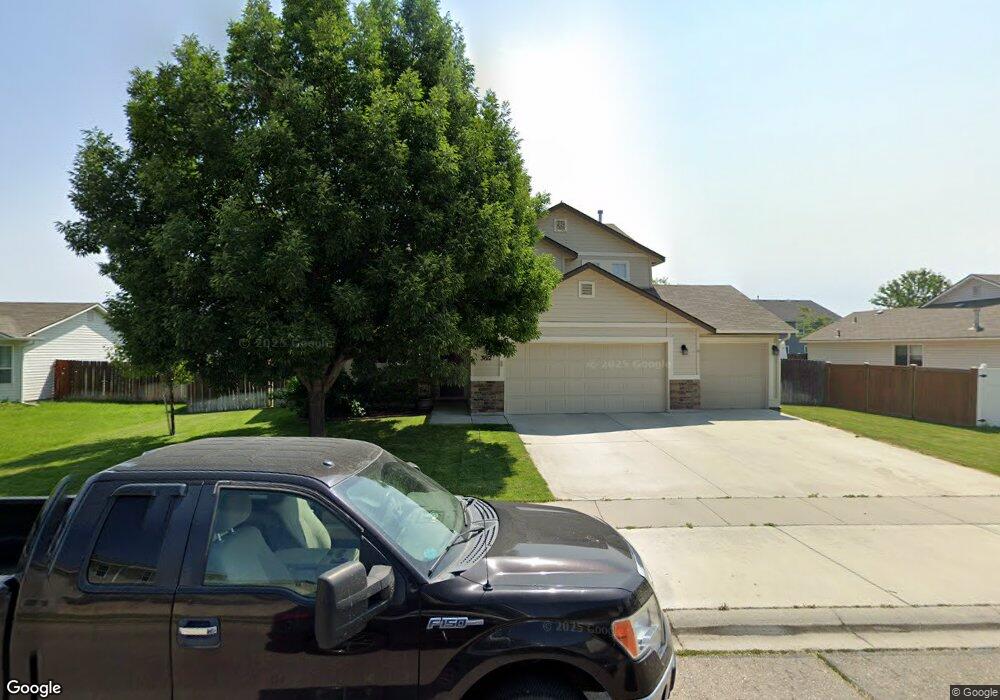
This home is located at 3612 S Twin Springs Way, Nampa, ID 83686 and is currently estimated at $435,255, approximately $211 per square foot. 3612 S Twin Springs Way is a home located in Canyon County with nearby schools including Reagan Elementary School, East Valley Middle School, and Columbia High School.
Ownership History
Date
Name
Owned For
Owner Type
Purchase Details
Closed on
Oct 24, 2018
Sold by
Towns Phyllis M
Bought by
Young Clinton R and Young Heather A
Current Estimated Value
Home Financials for this Owner
Home Financials are based on the most recent Mortgage that was taken out on this home.
Original Mortgage
$165,000
Outstanding Balance
$144,196
Interest Rate
4.6%
Mortgage Type
New Conventional
Estimated Equity
$291,059
Purchase Details
Closed on
Jul 31, 2012
Sold by
Watkins Jimmy L
Bought by
Towns Phyllis M
Home Financials for this Owner
Home Financials are based on the most recent Mortgage that was taken out on this home.
Original Mortgage
$143,450
Interest Rate
3.56%
Mortgage Type
New Conventional
Purchase Details
Closed on
Jan 20, 2011
Sold by
Barton Corey
Bought by
Corey Barton Homes Inc and Cbh Homes
Create a Home Valuation Report for This Property
The Home Valuation Report is an in-depth analysis detailing your home's value as well as a comparison with similar homes in the area
Home Values in the Area
Average Home Value in this Area
Purchase History
| Date | Buyer | Sale Price | Title Company |
|---|---|---|---|
| Young Clinton R | -- | Pioneer Title Canyon | |
| Towns Phyllis M | -- | Pioneer Title Canyon Ca | |
| Towns Phyllis M | -- | Pioneer Title Company Ca | |
| Corey Barton Homes Inc | -- | Titleone Boise |
Source: Public Records
Mortgage History
| Date | Status | Borrower | Loan Amount |
|---|---|---|---|
| Open | Young Clinton R | $165,000 | |
| Previous Owner | Towns Phyllis M | $143,450 |
Source: Public Records
Tax History Compared to Growth
Tax History
| Year | Tax Paid | Tax Assessment Tax Assessment Total Assessment is a certain percentage of the fair market value that is determined by local assessors to be the total taxable value of land and additions on the property. | Land | Improvement |
|---|---|---|---|---|
| 2025 | $1,512 | $398,000 | $111,000 | $287,000 |
| 2024 | $1,512 | $369,100 | $98,700 | $270,400 |
| 2023 | $1,485 | $375,000 | $98,700 | $276,300 |
| 2022 | $2,141 | $415,000 | $123,400 | $291,600 |
| 2021 | $1,971 | $292,300 | $68,000 | $224,300 |
| 2020 | $1,965 | $251,700 | $49,000 | $202,700 |
| 2019 | $3,813 | $237,600 | $40,100 | $197,500 |
| 2018 | $2,099 | $0 | $0 | $0 |
| 2017 | $1,770 | $0 | $0 | $0 |
| 2016 | $1,770 | $0 | $0 | $0 |
| 2015 | $1,715 | $0 | $0 | $0 |
| 2014 | $1,888 | $180,800 | $23,500 | $157,300 |
Source: Public Records
Map
Nearby Homes
- 3669 E Shadow Ridge Dr
- 3463 S Cape Coral Ave
- 3410 S Ridge Hill Ave
- 3816 E Berwick Dr
- 3392 S Ridge Hill Ave
- 3714 E Holly Ridge Dr
- 3499 S Rosa Parks Way
- 3991 Briggs Ct
- 4065 E Eagle Ridge Dr
- 3860 E Syracuse St
- 3705 S Julianite Ave
- 3545 S Fork Ave
- 3914 E Syracuse St
- 5010 S Lava Springs Loop
- 4305 S Oilseed Ave Unit Lot 10 Block 10
- 4410 E Stone Falls Dr
- 2816 E Andesite Ct
- 2999 S Grand Mere Dr
- 4178 E Thomas Mill Dr
- 4531 S Lava Springs Loop
- 3612 S Twin Springs Way
- 3618 S Twin Springs Way
- 3606 S Twin Springs Way
- 3701 S Confederate Ave
- 3700 S Twin Springs Way
- 3679 S Confederate Ave
- 3419 E Moon Creek Ave
- 3600 S Twin Springs Way
- 3745 S Confederate Ave
- 3723 S Confederate Ave
- 3657 S Confederate Ave
- 3613 S Twin Springs Way
- 3767 S Confederate Ave
- 3411 E Moon Creek Ave
- 3619 S Twin Springs Way
- 3706 S Twin Springs Way
- 3635 S Confederate Ave
- 3536 S Twin Springs Way
- 3539 S Twin Springs Way
- 3574 E Kendrick Dr