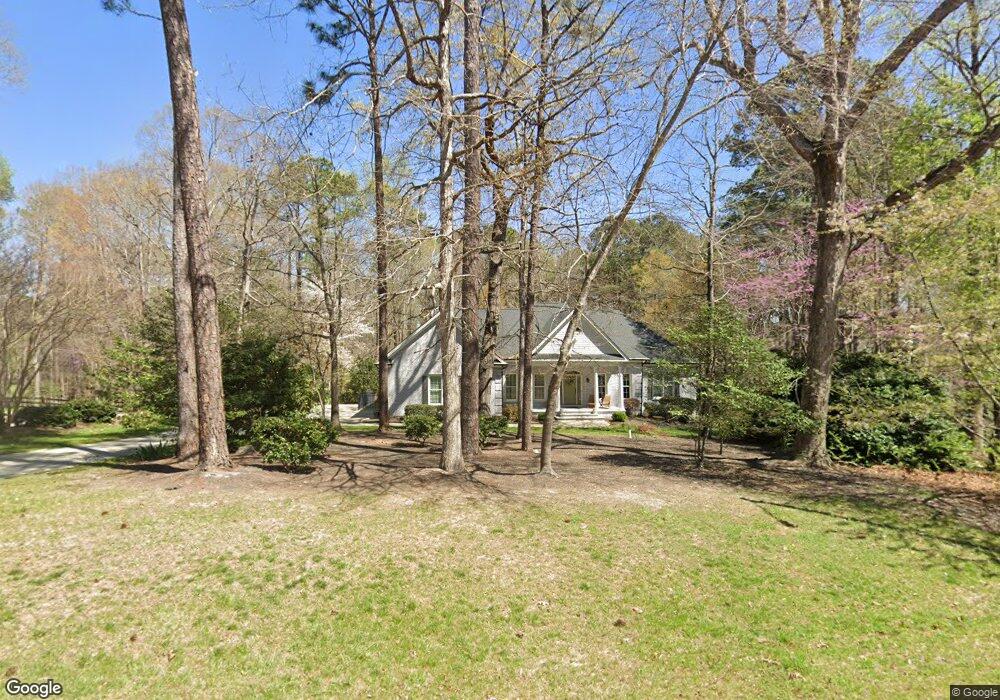
3613 Choplinshire Way Apex, NC 27539
Middle Creek NeighborhoodEstimated Value: $814,000 - $882,453
3
Beds
3
Baths
3,320
Sq Ft
$257/Sq Ft
Est. Value
About This Home
This home is located at 3613 Choplinshire Way, Apex, NC 27539 and is currently estimated at $853,363, approximately $257 per square foot. 3613 Choplinshire Way is a home located in Wake County with nearby schools including Yates Mill Elementary School, Dillard Drive Magnet Middle School, and Middle Creek High.
Ownership History
Date
Name
Owned For
Owner Type
Purchase Details
Closed on
Sep 20, 2013
Sold by
Matbisen Kenneth and Brooks Matbisen Rose Wynne
Bought by
Armstrong John Hadyn and Armstrong Myra
Current Estimated Value
Home Financials for this Owner
Home Financials are based on the most recent Mortgage that was taken out on this home.
Original Mortgage
$399,000
Outstanding Balance
$297,629
Interest Rate
4.39%
Mortgage Type
New Conventional
Estimated Equity
$555,734
Purchase Details
Closed on
Jun 1, 2009
Sold by
Galvin Matthew P and Glisson Betty J
Bought by
Mathisen Kenneth and Brooks Mathisen Rose Wynne
Home Financials for this Owner
Home Financials are based on the most recent Mortgage that was taken out on this home.
Original Mortgage
$345,600
Interest Rate
4.81%
Mortgage Type
Purchase Money Mortgage
Create a Home Valuation Report for This Property
The Home Valuation Report is an in-depth analysis detailing your home's value as well as a comparison with similar homes in the area
Home Values in the Area
Average Home Value in this Area
Purchase History
| Date | Buyer | Sale Price | Title Company |
|---|---|---|---|
| Armstrong John Hadyn | $420,000 | None Available | |
| Mathisen Kenneth | $432,000 | None Available |
Source: Public Records
Mortgage History
| Date | Status | Borrower | Loan Amount |
|---|---|---|---|
| Open | Armstrong John Hadyn | $399,000 | |
| Previous Owner | Mathisen Kenneth | $345,600 |
Source: Public Records
Tax History Compared to Growth
Tax History
| Year | Tax Paid | Tax Assessment Tax Assessment Total Assessment is a certain percentage of the fair market value that is determined by local assessors to be the total taxable value of land and additions on the property. | Land | Improvement |
|---|---|---|---|---|
| 2025 | -- | $790,657 | $209,000 | $581,657 |
| 2024 | $4,930 | $790,657 | $209,000 | $581,657 |
| 2023 | $3,892 | $496,639 | $88,000 | $408,639 |
| 2022 | $3,607 | $496,639 | $88,000 | $408,639 |
| 2021 | $3,510 | $496,639 | $88,000 | $408,639 |
| 2020 | $3,452 | $496,639 | $88,000 | $408,639 |
| 2019 | $3,772 | $459,446 | $94,600 | $364,846 |
| 2018 | $3,468 | $459,446 | $94,600 | $364,846 |
| 2017 | $3,287 | $459,446 | $94,600 | $364,846 |
| 2016 | $3,220 | $459,446 | $94,600 | $364,846 |
| 2015 | $2,936 | $419,883 | $86,000 | $333,883 |
| 2014 | $2,783 | $419,883 | $86,000 | $333,883 |
Source: Public Records
Map
Nearby Homes
- 6512 Ten Rd
- 6512 Ten-Ten Rd
- 3505 Knightshire Dr
- 3710 Johnson Pond Rd
- 8004 Deer Meadow Dr
- 8008 Deer Meadow Dr
- 4104 Cross Timber Ln
- 3901 Bluffwind Dr
- 5228 Trilogy Farm Dr
- 5300 Trilogy Farm Dr
- 8201 Rhodes Rd
- 5112 Lizard Tail Ln
- 7513 Orchard Crest Ct
- 3732 Westbury Lake Dr
- 8844 Forester Ln
- 3740 Westbury Lake Dr
- 4301 New Brighton Dr
- 5702 Volos Ave
- 4317 Glen Arbor Dr
- 8224 Bells Lake Rd
- 3609 Choplinshire Way
- 3617 Choplinshire Way
- 3614 Choplinshire Way
- 3622 Choplinshire Way
- 3618 Choplinshire Way
- 3612 Glenrothes Cove
- 3616 Glenrothes Cove
- 3608 Glenrothes Cove
- 3610 Choplinshire Way
- 3620 Glenrothes Cove
- 2509 Maxton Crest Dr
- 2501 Maxton Crest Dr
- 2517 Maxton Crest Dr
- 3605 Choplinshire Way
- 3624 Glenrothes Cove
- 3805 Kingfield Dr
- 2521 Maxton Crest Dr
- 3613 Glenrothes Cove
- 3509 Viscount Ln
- 3609 Glenrothes Cove