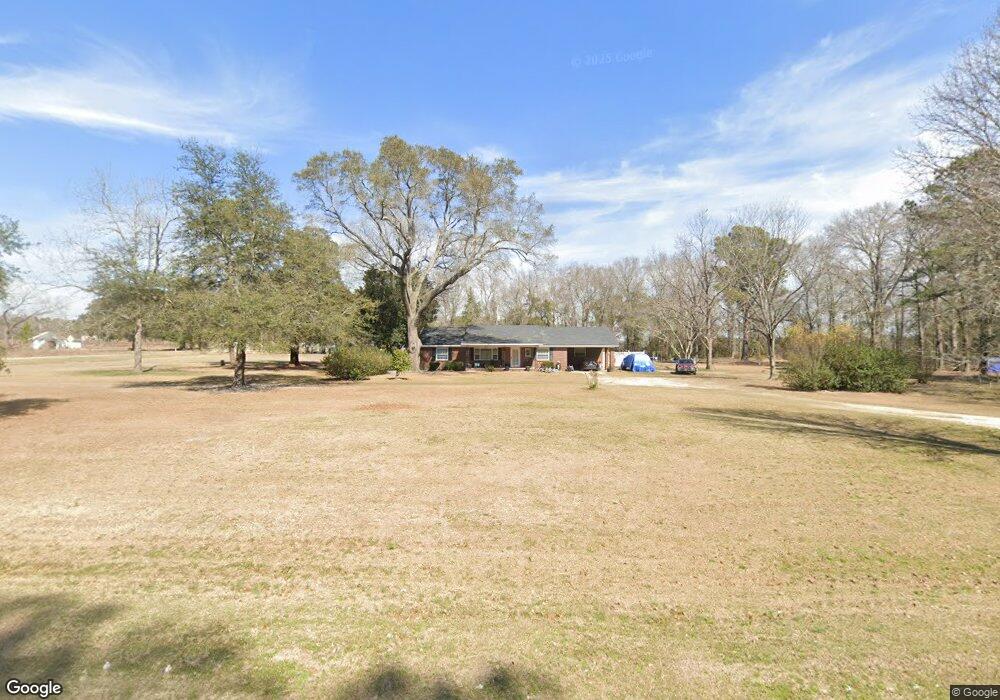
3613 Nevils Daisy Rd Statesboro, GA 30458
Estimated Value: $272,000 - $428,000
3
Beds
1
Bath
2,127
Sq Ft
$159/Sq Ft
Est. Value
About This Home
This home is located at 3613 Nevils Daisy Rd, Statesboro, GA 30458 and is currently estimated at $337,307, approximately $158 per square foot. 3613 Nevils Daisy Rd is a home located in Bulloch County with nearby schools including Nevils Elementary School, Southeast Bulloch High School, and Southeast Bulloch Middle School.
Ownership History
Date
Name
Owned For
Owner Type
Purchase Details
Closed on
Feb 9, 2009
Sold by
Fulmer Eric F
Bought by
Tiegue Tina Darlene
Current Estimated Value
Home Financials for this Owner
Home Financials are based on the most recent Mortgage that was taken out on this home.
Original Mortgage
$143,367
Outstanding Balance
$90,480
Interest Rate
5.07%
Mortgage Type
New Conventional
Estimated Equity
$246,827
Purchase Details
Closed on
Aug 10, 2005
Sold by
Driggers Charles A
Bought by
Fulmer Eric F and Fulmer Kimberly T
Home Financials for this Owner
Home Financials are based on the most recent Mortgage that was taken out on this home.
Original Mortgage
$126,500
Interest Rate
5.61%
Mortgage Type
New Conventional
Purchase Details
Closed on
Jul 25, 2005
Sold by
Driggers Marcia B
Bought by
Driggers Charles A
Home Financials for this Owner
Home Financials are based on the most recent Mortgage that was taken out on this home.
Original Mortgage
$126,500
Interest Rate
5.61%
Mortgage Type
New Conventional
Purchase Details
Closed on
Jun 1, 2003
Bought by
Driggers Charles A
Create a Home Valuation Report for This Property
The Home Valuation Report is an in-depth analysis detailing your home's value as well as a comparison with similar homes in the area
Home Values in the Area
Average Home Value in this Area
Purchase History
| Date | Buyer | Sale Price | Title Company |
|---|---|---|---|
| Tiegue Tina Darlene | $134,500 | -- | |
| Fulmer Eric F | $127,500 | -- | |
| Driggers Charles A | -- | -- | |
| Driggers Charles A | -- | -- |
Source: Public Records
Mortgage History
| Date | Status | Borrower | Loan Amount |
|---|---|---|---|
| Open | Tiegue Tina Darlene | $143,367 | |
| Previous Owner | Fulmer Eric F | $126,500 |
Source: Public Records
Tax History Compared to Growth
Tax History
| Year | Tax Paid | Tax Assessment Tax Assessment Total Assessment is a certain percentage of the fair market value that is determined by local assessors to be the total taxable value of land and additions on the property. | Land | Improvement |
|---|---|---|---|---|
| 2024 | $1,621 | $74,760 | $19,880 | $54,880 |
| 2023 | $1,564 | $66,280 | $13,880 | $52,400 |
| 2022 | $1,180 | $56,695 | $11,578 | $45,117 |
| 2021 | $1,059 | $49,837 | $11,578 | $38,259 |
| 2020 | $994 | $45,742 | $9,648 | $36,094 |
| 2019 | $1,006 | $46,042 | $9,648 | $36,394 |
| 2018 | $897 | $40,763 | $8,038 | $32,725 |
| 2017 | $869 | $39,058 | $8,038 | $31,020 |
| 2016 | $860 | $37,695 | $8,038 | $29,657 |
| 2015 | $838 | $36,539 | $8,038 | $28,500 |
| 2014 | $774 | $36,539 | $8,038 | $28,500 |
Source: Public Records
Map
Nearby Homes
- 201 Cumberland Point
- 0 Twin Forks Rd Unit 10462786
- 204 Nevils Groveland Rd
- 0 Peppercorn Trail Unit SA335417
- 4750 Deloach Church Rd
- 1694 Bragan Rd
- 3193 Old Groveland Rd
- 1122 Turf Rd
- 5185 Old Groveland Rd
- 3900 Nevils Groveland Rd
- 1533 Gw Oliver Rd
- 0 G W Oliver Rd
- 1930 Old Groveland Rd
- 2784 Brooklet Denmark Rd
- 0 Clifton Rd Unit SA339976
- 0 Clifton Rd Unit Lot 3 SA339975
- 0 Clifton Rd Unit LOT 3 10607565
- 0 Clifton Rd Unit 10585882
- 0 R P Miller Rd
- 0 Mosley Rd Unit 10592562
- 237 Reedy Branch Rd
- 3399 Nevils Daisy Rd
- 3854 Twin Forks Rd
- 3738 Nevils Daisy Rd
- 3892 Twin Forks Rd
- 3919 Twin Forks Rd
- 294 Reedy Branch Rd
- 180 Thompson Ln
- 233 Twin Forks Place
- 3048 Nevils Daisy Rd
- 4015 Nevils Daisy Rd
- 4048 Nevils Daisy Rd
- 195 Twin Forks Place
- 287 Thompson Ln
- 3022 Nevils Daisy Rd
- 394 Thompson Ln
- 143 Thompson Ln
- 4049 Twin Forks Rd
- 3140 Twin Forks Rd
- 4167 Nevils Daisy Rd