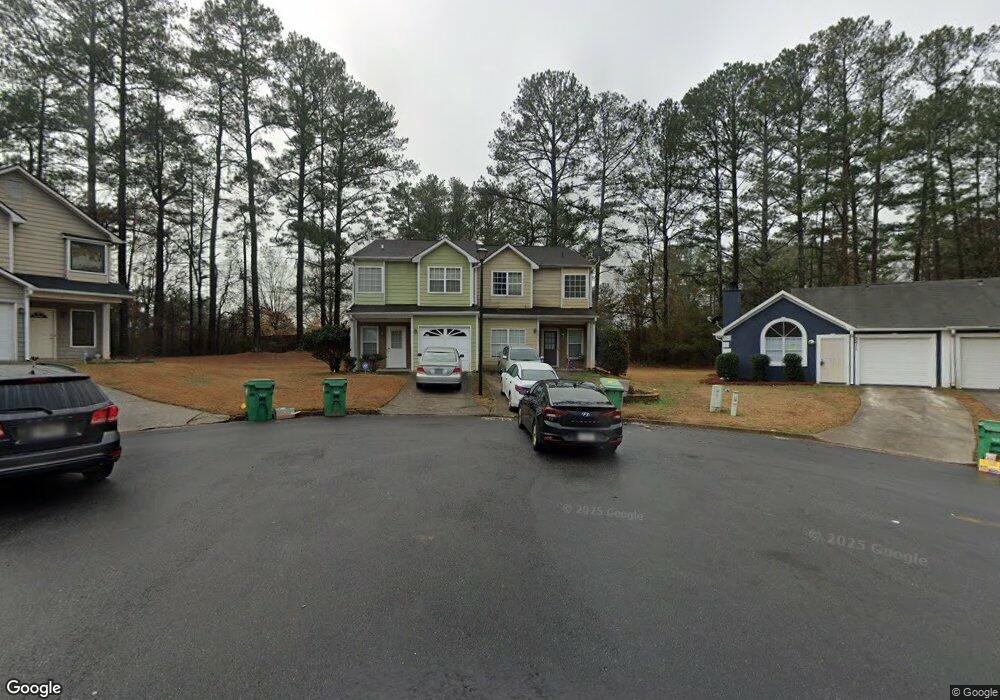
3613 Spring Point Decatur, GA 30034
Southwest DeKalb NeighborhoodEstimated Value: $208,000 - $217,000
3
Beds
3
Baths
1,586
Sq Ft
$134/Sq Ft
Est. Value
About This Home
This home is located at 3613 Spring Point, Decatur, GA 30034 and is currently estimated at $212,470, approximately $133 per square foot. 3613 Spring Point is a home located in DeKalb County with nearby schools including Bob Mathis Elementary School, Chapel Hill Middle School, and Southwest Dekalb High School.
Ownership History
Date
Name
Owned For
Owner Type
Purchase Details
Closed on
May 21, 2024
Sold by
Agee Hervy
Bought by
Monds Roccier D
Current Estimated Value
Purchase Details
Closed on
Nov 30, 2011
Sold by
Agee Hervy
Bought by
Agee Hervy and Agee Roccier Monds
Home Financials for this Owner
Home Financials are based on the most recent Mortgage that was taken out on this home.
Original Mortgage
$22,416
Interest Rate
4.87%
Mortgage Type
FHA
Purchase Details
Closed on
Dec 24, 2010
Sold by
Stfleur Micheline
Bought by
Douce Melloney J
Purchase Details
Closed on
May 12, 2005
Sold by
Federal Home Loan Mortgage Corporation
Bought by
Douce Melloney J and St Fleur Micheline
Home Financials for this Owner
Home Financials are based on the most recent Mortgage that was taken out on this home.
Original Mortgage
$86,400
Interest Rate
5.98%
Purchase Details
Closed on
Oct 5, 2004
Sold by
Thompson Willene J
Bought by
Principal Residl Mtg Inc
Create a Home Valuation Report for This Property
The Home Valuation Report is an in-depth analysis detailing your home's value as well as a comparison with similar homes in the area
Home Values in the Area
Average Home Value in this Area
Purchase History
We collect this data history from publicly available records. To have your information removed, we recommend requesting removal directly through your county’s website.
| Date | Buyer | Sale Price | Title Company |
|---|---|---|---|
| Monds Roccier D | -- | -- | |
| Agee Hervy | -- | -- | |
| Agee Hervy | $23,000 | -- | |
| Douce Melloney J | -- | -- | |
| Douce Melloney J | -- | -- | |
| Principal Residl Mtg Inc | $106,427 | -- |
Source: Public Records
Mortgage History
We collect this data history from publicly available records. To have your information removed, we recommend requesting removal directly through your county’s website.
| Date | Status | Borrower | Loan Amount |
|---|---|---|---|
| Previous Owner | Agee Hervy | $22,416 | |
| Previous Owner | Douce Melloney J | $86,400 |
Source: Public Records
Tax History
| Year | Tax Paid | Tax Assessment Tax Assessment Total Assessment is a certain percentage of the fair market value that is determined by local assessors to be the total taxable value of land and additions on the property. | Land | Improvement |
|---|---|---|---|---|
| 2025 | $4,366 | $89,640 | $10,000 | $79,640 |
| 2024 | $2,180 | $88,080 | $10,000 | $78,080 |
| 2023 | $2,180 | $82,080 | $10,000 | $72,080 |
| 2022 | $1,580 | $66,160 | $7,200 | $58,960 |
| 2021 | $1,252 | $51,960 | $7,200 | $44,760 |
| 2020 | $860 | $34,840 | $7,200 | $27,640 |
| 2019 | $936 | $38,120 | $7,200 | $30,920 |
| 2018 | $632 | $23,280 | $2,400 | $20,880 |
| 2017 | $409 | $15,320 | $2,400 | $12,920 |
| 2016 | $423 | $14,520 | $1,960 | $12,560 |
| 2014 | $352 | $8,560 | $1,960 | $6,600 |
Source: Public Records
Map
Nearby Homes
- 3653 Woodland Cove
- 3672 Platina Park Ct
- 3523 Lehigh Way
- 3860 Brookview Point
- 3868 Brookview Point Unit 5B
- 3648 Sapphire Ct
- 3562 Matthew Ct
- 3608 Shepherds Path
- 3622 Shepherds Path Unit 3622
- 3526 Shepherds Path Unit 1
- 3468 Lehigh Way
- 3521 Shepherds Path
- 3567 Hancock View
- 3801 Cherry Ridge Blvd
- 4056 Wortham Way
- 3811 Holy Cross Ct Unit 2
- 3946 Flakes Mill Rd
- 3778 Guilford Ct
- 4019 Wintersweet Dr
- 3609 River Edge Ct
- 3612 Spring Point
- 3611 Spring Point
- 3609 Spring Point
- 3610 Spring Point
- 3607 Spring Point
- 3607 Spring Point Unit .
- 3608 Spring Point
- 3605 Spring Point
- 3612 Spring Trace
- 3610 Spring Trace
- 3606 Spring Point
- 3603 Spring Point
- 3608 Spring Trace
- 3604 Spring Point
- 3636 Belmont Abbey Dr
- 3606 Spring Trace
- 3601 Spring Point
- 3602 Spring Point
- 3614 Spring Trace
- 3765 Flakes Mill Rd
Your Personal Tour Guide
Ask me questions while you tour the home.