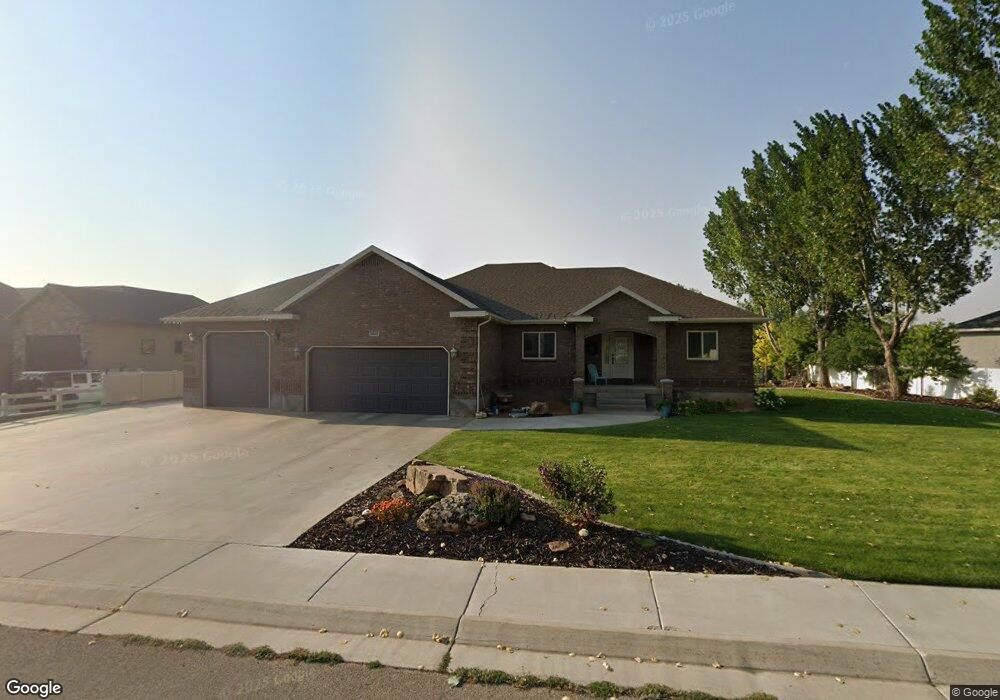
3613 W 1350 N Vernal, UT 84078
Estimated Value: $469,000 - $645,000
5
Beds
4
Baths
4,422
Sq Ft
$125/Sq Ft
Est. Value
About This Home
This home is located at 3613 W 1350 N, Vernal, UT 84078 and is currently estimated at $554,184, approximately $125 per square foot. 3613 W 1350 N is a home located in Uintah County with nearby schools including Maeser School, Uintah Middle School, and Vernal Middle School.
Ownership History
Date
Name
Owned For
Owner Type
Purchase Details
Closed on
Feb 28, 2019
Sold by
Labrum E Jed and Labrum Brooke
Bought by
Brooke B Labrum 2019 T
Current Estimated Value
Purchase Details
Closed on
Nov 3, 2017
Sold by
May Andrew R and May Angela M
Bought by
Labrum Labrum E and Labrum Brooke
Purchase Details
Closed on
May 3, 2010
Sold by
Angus Jed
Bought by
Angus Jed
Home Financials for this Owner
Home Financials are based on the most recent Mortgage that was taken out on this home.
Original Mortgage
$125,000
Interest Rate
4.94%
Mortgage Type
New Conventional
Purchase Details
Closed on
Mar 23, 2009
Sold by
Allen Kevin F and Allen Cathy
Bought by
Angus Jed
Create a Home Valuation Report for This Property
The Home Valuation Report is an in-depth analysis detailing your home's value as well as a comparison with similar homes in the area
Home Values in the Area
Average Home Value in this Area
Purchase History
| Date | Buyer | Sale Price | Title Company |
|---|---|---|---|
| Brooke B Labrum 2019 T | -- | -- | |
| Labrum Labrum E | -- | Advanced Title | |
| Angus Jed | -- | -- | |
| Angus Jed | -- | -- |
Source: Public Records
Mortgage History
| Date | Status | Borrower | Loan Amount |
|---|---|---|---|
| Previous Owner | Angus Jed | $125,000 |
Source: Public Records
Tax History Compared to Growth
Tax History
| Year | Tax Paid | Tax Assessment Tax Assessment Total Assessment is a certain percentage of the fair market value that is determined by local assessors to be the total taxable value of land and additions on the property. | Land | Improvement |
|---|---|---|---|---|
| 2024 | $3,400 | $397,159 | $28,260 | $368,899 |
| 2023 | $3,400 | $355,016 | $28,260 | $326,756 |
| 2022 | $2,388 | $226,691 | $30,250 | $196,441 |
| 2021 | $2,387 | $102,256 | $15,125 | $87,131 |
| 2020 | $2,329 | $185,920 | $27,500 | $158,420 |
| 2019 | $2,359 | $185,920 | $27,500 | $158,420 |
| 2018 | $2,262 | $178,376 | $27,500 | $150,876 |
| 2017 | $26 | $207,925 | $30,250 | $177,675 |
| 2016 | $2,401 | $207,925 | $30,250 | $177,675 |
| 2015 | $2,216 | $207,925 | $30,250 | $177,675 |
| 2014 | $2,183 | $207,925 | $30,250 | $177,675 |
| 2013 | $2,231 | $207,925 | $24,750 | $183,175 |
Source: Public Records
Map
Nearby Homes
- 1428 N 4075 W
- 1482 N 4075 W
- 1168 N 4090 W
- 1198 N 4090 W
- 1165 N 4090 W Unit 11
- 2993 W 1500 N
- 1388 N 4075 W
- 1298 N 4075 W
- 1320 N 4075 W
- 3543 W 700 N
- 2396 W 1500 N
- 486 N 3500 W
- 2756 W 1000 N
- 689 N 4250 W
- 4231 W 650 N
- 4571 W Hillside Dr
- 631 N 4250 W
- 4835 W Hillside Dr
- 4845 W Hillside Dr
- 4190 W Delray Rd Unit 39
- 3613 W 1350 N Unit 11
- 3589 W 1350 N Unit 12
- 3589 W 1350 N
- 3610 W 1350 N Unit 3
- 3637 W 1350 N Unit 10
- 3637 W 1350 N
- 3565 W 1350 N Unit 13
- 3565 W 1350 N
- 3654 W 1350 N
- 3670 W 1350 N
- 1270 N 3620 W
- 3661 W 1350 N Unit 9
- 3661 W 1350 N
- 3541 W 1350 N Unit 14
- 3541 W 1350 N
- 1263 N 3620 W
- 1259 N 3560 W
- 3517 W 1350 N Unit 15
- 3517 W 1350 N
- 1299 N 3500 W